Finding ERP peak latencies
Peaks of activity in the subject or grand average ERPs may arise from complex processes due to partial phase synchronization. We urge researchers to go beyond this simplified measure. Nevertheless, we include this tutorial section because this approach remains popular in the community.
ERP peak characteristic using Matlab zoom
Although EEGLAB currently does not have tools for automatically finding ERP peak amplitudes and latencies, one can use the convenient MATLAB zoom facility to visually determine the exact amplitude and latency of a peak in any MATLAB figure.
For example, in the figure above, select the magnifying-glass icon having the + sign. Then, zoom in on the red curve’s peak, as shown below (click on the left mouse button to zoom in and on the right button to zoom out). Read the peak latency and amplitude to any desired precision from the axis scale.
ERPLAB and EEGLAB bioelectromag plugin
EEGLAB extensions, including bioelectromag and ERPLAB, allow performing more advanced ERP peak detection. These extensions are available from the EEGLAB extension manager, which may be invoked by selecting the File → Manage EEGLAB extensions menu item.
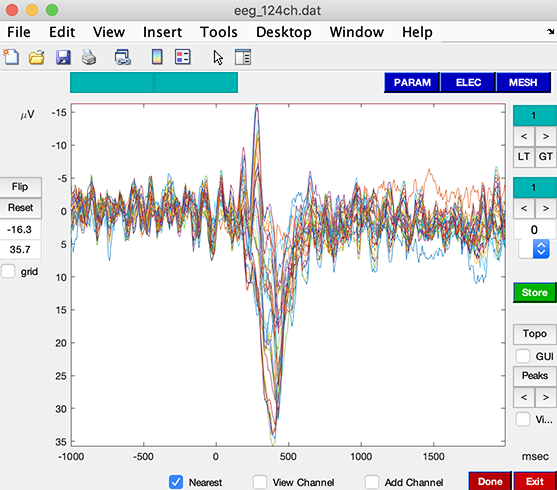
Below is a plot showing the [bioelectromag] interface after loading the EEGLAB tutorial epoched dataset “eeglab_data_epochs_ica.set”.