Scrolling and rejecting data
Here we learn how to visualize and to reject selected portions of continuous EEG channel data.
Load the sample EEGLAB dataset
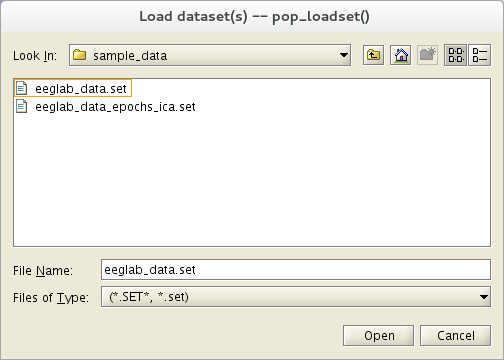
Select the File → Load existing dataset menu item. Select the tutorial file “eeglab_data.set” distributed with the toolbox and located in the “sample_data” folder of EEGLAB. Then press Open.
Scrolling data
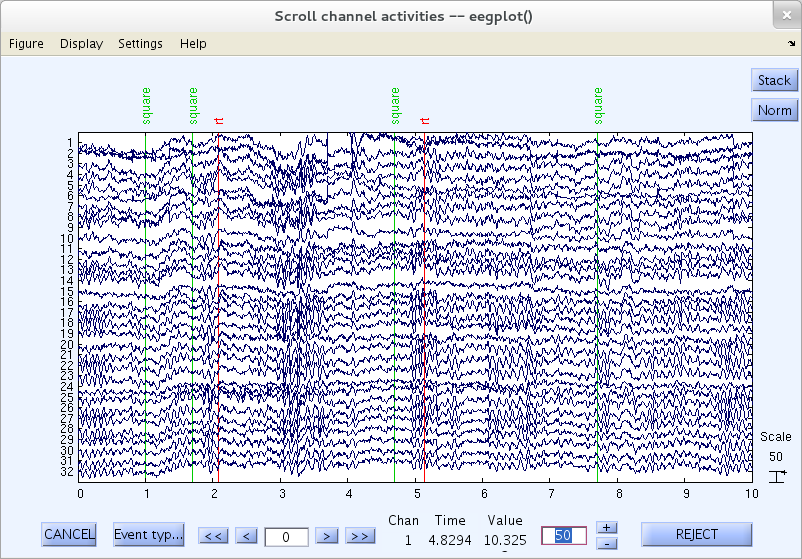
To scroll through the channel data of the current dataset, select Plot → Channel data (scroll). This pops up the eegplot.m the scrolling data display window below.
Note that this sample data file contains as-if-continuous EEG data. To reduce (your) download time, this “pseudo-continuous” EEG dataset was artificially constructed by concatenating eighty separate three-second data epochs (which we will later separate again). This explains some sudden jumps you may see in some data channels.
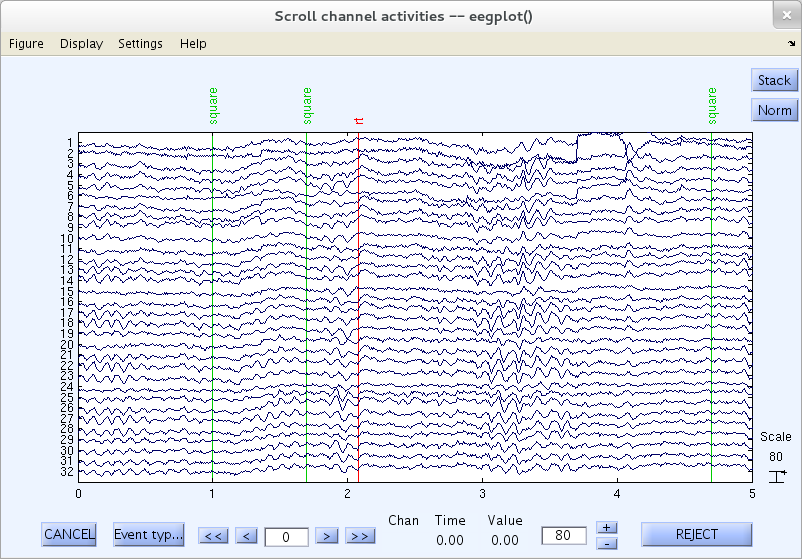
To the right of the plotting window, is the vertical scale value (and its unit, microvolts) that indicates the “amplitude” of the vertical scale bar. In this case, that value is 80 (microvolts). The same value is also shown in the lower right-hand edit box, where we can change it as explained below.
Voltage Scale
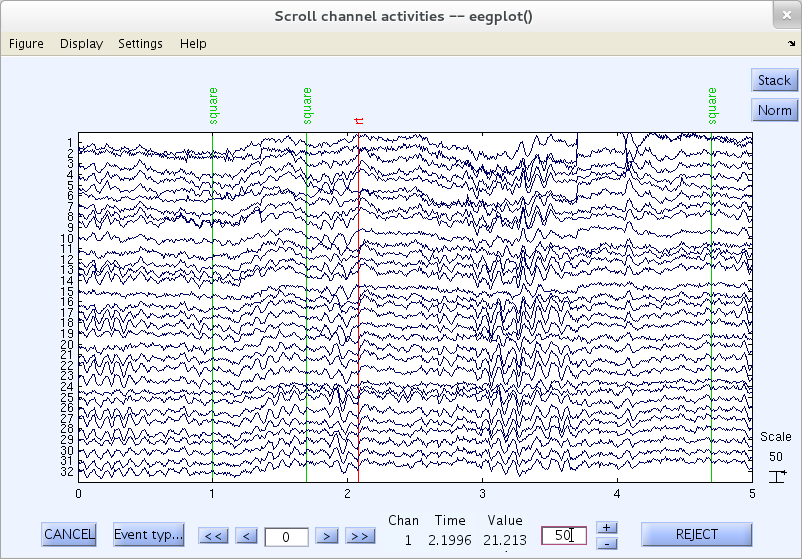
Change the “Scale” edit-text box value to about 50, either by repeatedly clicking on the ”-“ button or by editing the text value from the keyboard, and press the Enter key to update the scrolling window.
Adjusting the width of the scrolling time window
To adjust the time range displayed (i.e., the horizontal scale), select the eegplot.m menu item Settings → Time range to display, and set the desired window length to “10” seconds as shown below,
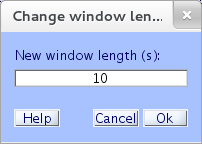
Then press Ok to make the indicated change take effect.
Number of Channels to Display
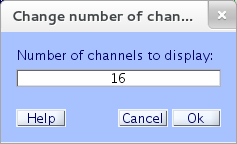
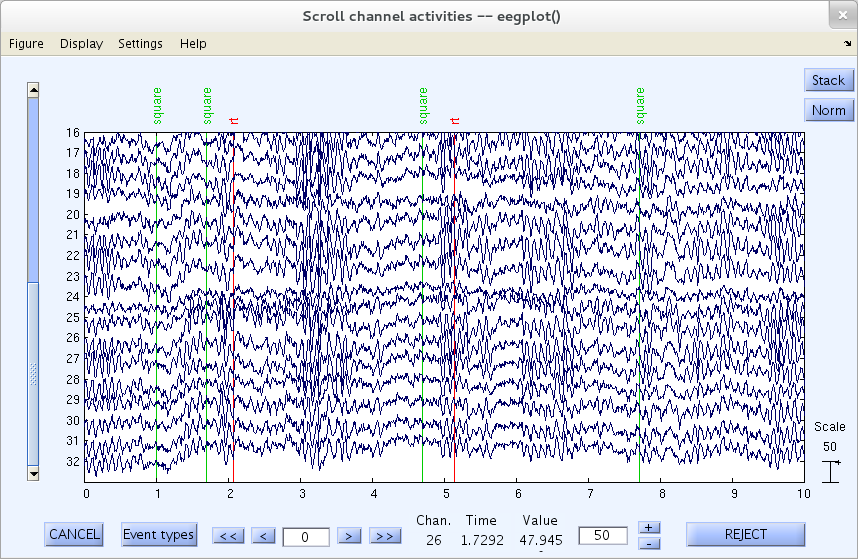
To adjust the number of channels displayed, select eegplot.m menu item Settings → Number of channels to display and enter the desired number of channels to display on the screen (for instance, “16”).
Reducing the number of channels shown will return a scrolling eegplot.m window with a vertical channel-set slider to the left of the plot. Use it to scroll the display (vertically) through all the channels.
Zoom on data
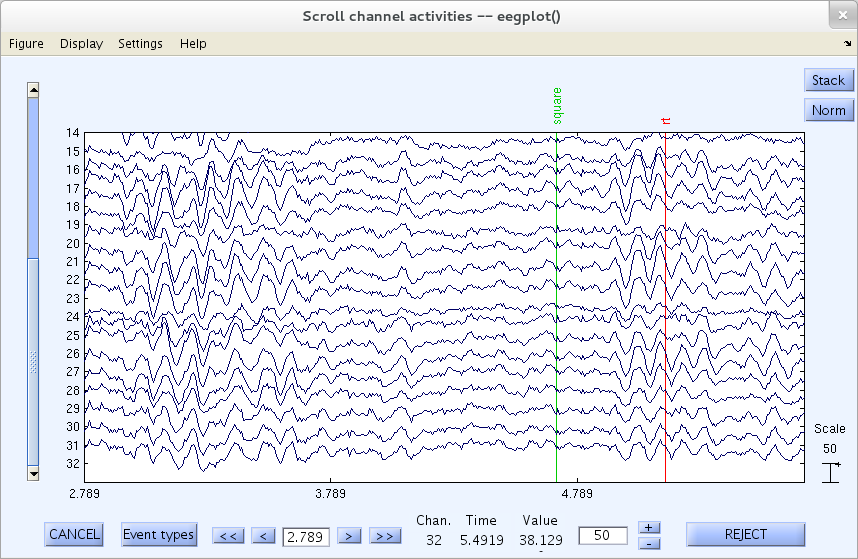
To zoom in on a particular area of a data window, select eegplot.m menu item Settings → Zoom off/on → Zoom on. Using your mouse, drag a rectangle around an area of the data to zoom in on it. The scrolling window may now look similar to the one below. Click the right button on the mouse to zoom out again. Use menu item Setting → Zoom off/on → Zoom off to turn off the zoom option.
Rejecting Data
The eegplot.m window also allows you to reject (erase) arbitrary portions of the continuous data. The function eegplot.m can be called from both menu items Tools → Inspect/reject data by eye and Plot → Channel data (scroll). Depending on which menu item you select, a warning message may appear; click on Continue.
To erase a selected portion of the data, first drag the mouse (holding down the left mouse button) horizontally across the time region of interest to mark it for rejection. If you like, mark multiple regions for rejection in this way.
Note: Zooming must be disabled to select a portion of the data.
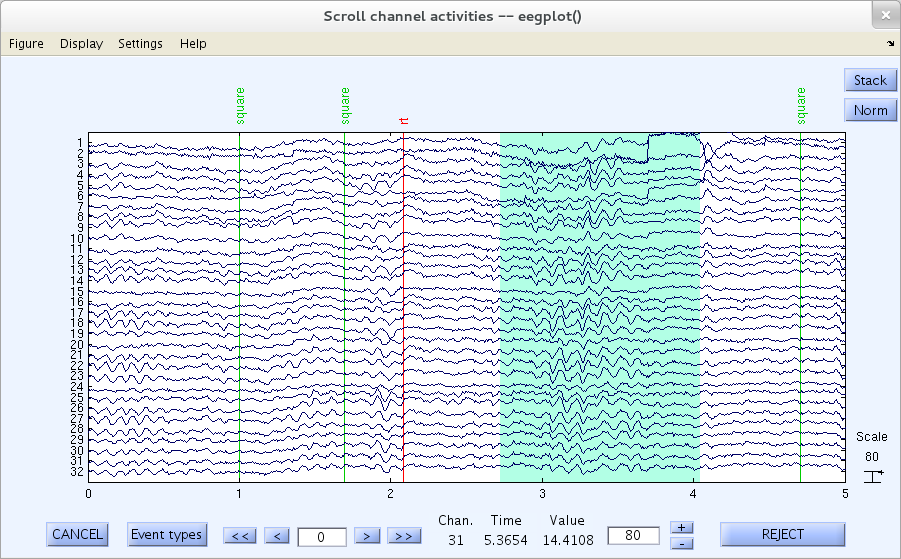
Note: To select portions of data that extend out of the plotting window, simply drag the mouse over the new region and connect it to a previously marked region. For instance, in the following plotting window, which already had the time interval 2.1 seconds to 3.4 seconds selected (as shown above), drag the mouse from 6.9 seconds back to 4.7.
Note: To deselect a portion of the data, simply click on the selected region. This allows re-inspection of the data portions marked for rejection in two or more passes, e.g., after the user has developed a more consistent rejection strategy or threshold.

After marking some portions of the data for rejection, press REJECT and a new data set will be created with the rejected data omitted. A new dataset will be created with the marked regions removed.
Click Ok to create the new dataset with the marked data portions removed.
EEGLAB adjust the EEG.event structure fields and insert boundary events where data has been rejected, with a duration field holding the duration of the data portion that was rejected. EEGLAB will also link these events in a backup copy of the experiment event record contained in the EEG.urevent structure. Rejection boundary events ensure that subsequent epoch selections do not cross non-contiguous rejection boundaries. Thus, rejection on continuous data must be performed ‘before’ separating it into data epochs. To plot the data with the boundary event use menu item Plot → Channel data (scroll) on the new dataset as shown below (the thick red event mark is a boundary event).

We only performed this rejection for illustrative purposes. You may restart EEGLAB or switch back to the original dataset by selecting the main window menu item Datasets → Dataset 1: Continuous EEG data.
Strategy for rejecting bad portions of data
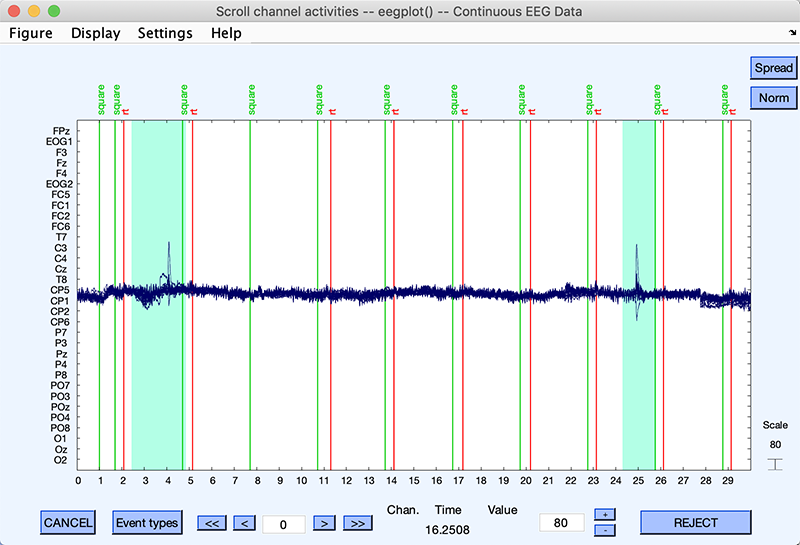
One strategy to reject bad portions of data is to stack the data using the Stack button of the eegplot.m window (upper right corner) and display about 30 seconds of data (see a previous section for changing the size of the time window). This makes it easy to spot and remove artifacts as shown below. Using a 30-second window also allows for faster data cleaning. Note that the continuous tutorial dataset is already clean. The regions selected below are blinks that may be subtracted from the data using ICA, so they may be left in the data (they are selected for rejection for illustrative purpose).
Rejecting bad portions of data surrounding events
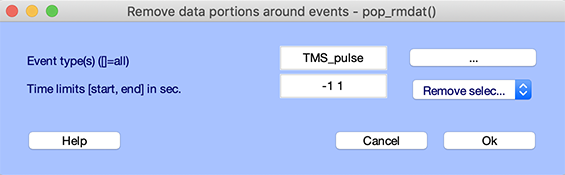
There might be cases where one might want to reject portions of data surrounding events of interest. For example, TMS pulses often saturate EEG amplifiers, and the data needing to be removed around these events. If this is the case, use the Edit → Select data using events menu item. Assuming your data contains events of the “TMS_pulse” type the option below will remove 2 seconds of data surrounding these events.
Interpolating a single bad channel
No function or GUI is available for interpolating a single bad channel. However, you can run the simple script below after adjusting the electrode(s) and time range of interest.
EEGOUT = eeg_interp(EEG, {'Cz'}, 'spherical', [12.3 12.85]);

% Then store the dataset
EEG = eeg_checkset(EEG);
ALLEEG = eeg_store(ALLEEG, EEG, CURRENTSET);
eeglab redraw