Equivalent dipole source localization of independent components
A major obstacle to using EEG data to visualize macroscopic brain dynamics is the underdetermined nature of the inverse problem: Given an EEG scalp distribution of activity observed at given scalp electrodes, any number of brain source activity distributions can be found that would produce it. This is because there is any number of possible brain source area pairs or etc. that, jointly, add to the scalp data. Therefore, solving this EEG inverse problem requires making additional assumptions about the nature of the source distributions. A computationally tractable approach is to find some number of brain current dipoles (like vanishingly small batteries) whose summed projections to the scalp most nearly resemble the observed scalp distribution. In this section of the tutorial, we show how to solve this problem using ICA.
Table of contents
- Rational for localizing ICA components
- What reference for ICA components?
- Dipole fitting with DIPFIT
- Prepare data for component dipole fitting
- Select components of interest
- Initial fitting - Scanning on a coarse-grained grid
- Plotting dipole locations in 3-D volume
- Plotting dipole locations on scalp maps
- Interactive fine-grained fitting
- Fitting symmetrical dipoles
- Automated dipole fitting
- Advanced visualization of dipole models
- eLoreta using DIPFIT
- Using DIPFIT to fit independent MEG components
- DIPFIT structures and functions
- Literature references
Rational for localizing ICA components
Unfortunately, the problem of finding the locations of more than one simultaneously active equivalent dipoles also does not have a unique solution, and “best fit” solutions will differ depending on the observed scalp distribution(s) (or scalp maps) that are given to the source inversion algorithm. For this reason, approaches to solving the EEG inverse problem have tended to focus on fitting scalp maps in which a single dipolar scalp map is expected to be active, for instance, very early peaks in ERP (or magnetic ERF) response averages indexing the first arrival of sensory information in the cortex. Others attempt to fit multiple dipoles to longer portions of averaged ERP (or ERF) waveforms based on “prior belief” (i.e., guesses) as to where the sources should be located. This approach has often been criticized for not being based wholly on the observed data and thus subject to bias or ignorance. Using ICA to un-mix the continuous EEG data into brain and non-brain effective source processes is a radically different approach. ICA identifies temporally independent signal sources in multi-channel EEG data as well as their patterns of projection to the scalp electrodes, which are fixed for spatially stationary sources. These ICA ‘component maps’ are significantly more dipolar (i.e., “dipole-like”) than either the raw EEG or any average ERP at nearly any time point – even though neither the locations of the electrodes nor the biophysics of volume propagation is taken into account by ICA (Delorme et al., 2012). Many independent EEG components have scalp maps that nearly perfectly match the projection of a single equivalent brain dipole.
This finding is consistent with ICA components presumed generation via partial synchrony of local field potential (LFP) processes within a connected domain or patch of cortex. Because local cortical connections have a much higher density than longer-range connections, it is reasonable to assume that synchronous coupling of neuronal activity, as isolated by ICA, usually occurs within a single brain area. Some ICA component scalp maps do highly resemble the projection of a single equivalent dipole (or in some cases, a bilaterally symmetric pair of dipoles). Residual scalp maps variance of the best-fitting single- or two-dipole component models are often surprisingly low (see below), given the relative inaccuracy of the head models used to compute them. Such ICA components may thus represent the projection of activity from one (or two symmetric) patch(es) of cortex.
Fortunately, the problem of finding the location of a single equivalent dipole generating a given dipolar scalp map is well-posed, given a sufficiently accurate electrical ‘forward problem’ head model that specifies the resistance between each scalp electrode location and each possible (brain) source location. Mathematically, coherent local field potential (LFP) activity across a ‘cortical patch’ will have an equivalent single infinitesimal oriented dipole model whose scalp projection pattern matches the joint projection of the spatially coherent activity across the patch. In general, the location of the equivalent dipole for such a patch will be quite near (< 2 mm) but not necessarily precisely at the center of the patch. In particular, if the patch is radially oriented (e.g., on a cortical gyrus) and is thus facing the supervening scalp surface, the equivalent dipole tends to be slightly deeper than the cortical source patch. However, the location of the equivalent dipole for an effective source of this type is relatively easy to compute and easy to compare across conditions and subjects. We use the term effective source since currents from a spatially coherent (in-phase) signal across a cortical patch will make a much larger contribution to the scalp EEG than spatially incoherent (out-of-phase) activities from smaller domains within the same or any similar cortical patch because the out-of-phase contributions of the smaller domains will tend to cancel each other out at the scalp recording electrode (phase cancellation). Thus, even when the actual LFP magnitudes in a smaller cortical domain are no less than in the spatially coherent effective source patch, their net contribution to the scalp EEG will be minimal compared to the spatially coherent effective source.
EEGLAB includes two plugins for localizing equivalent dipole locations of independent component scalp maps: (1) the DIPFIT plugin described here and (2) the Neuroelectromagnetic Forward modeling Toolbox (NFT). The DIPFIT plugin is the default approach in EEGLAB. The NFT plugin can also perform distributed cortical source imaging and build individual subject electrical (forward) head models from an available subjects’ MR head image and sufficient EEG.
What reference for ICA components?
ICA components are reference-free. If you re-reference data after computing ICA components in EEGLAB, the ICA component scalp topography will remain the same. So ICA components, because of the ICA algorithm properties, are computed under the ideal infinity reference irrespective of the original reference of the data. However, this reference can only be approximated by creating a forward solution over the entire scalp. If the ICA topography and the forward solution of the dipole being fitted are not consistent (as they use different approximations of the infinite reference), then the optimal dipole(s) positions(s) are not accurately determined. In other words, we should not use ICA components scalp topography with an infinity reference source localization model. Instead, both the ICA topography and the dipole model should be re-referenced using the same infinite reference approximation.
In practice, before performing source localization in DIPFIT, the scalp topography of ICA components is recomputed using an average reference (the mean of the ICA projection to all channels is removed), as the forward model is also computed with an average reference. During dipole fitting, the model and the averaged reference ICA topography are compared, and dipole parameters are adjusted until the model matches the scalp topography as closely as possible. Thank you to Robert Oostenveld for helping clarify this section.
Dipole fitting with DIPFIT
Prepare data for component dipole fitting
To fit dipole models to ICA components in an EEGLAB dataset, you must at the very least:
- Import channel locations using the Edit → Channel locations menu item.
- High pass filter the data using the Tools → Filter the data → Basic FIR filter menu item.
- Run independent component analysis using the Tools → Decompose data by ICA menu item.
- Select head model using the Tools → Locate dipoles using DIPFIT → Head model and settings menu item.
Refer to the corresponding section of the tutorial for more information on these steps. To illustrate dipole fitting, we will use the tutorial dataset eeglab_dipole.set. This sample dataset contains a channel location file, pre-computed ICA weights, and head model.
Select menu item File → load existing dataset and select the tutorial file “eeglab_dipoles.set” downloaded above. Then press Open.
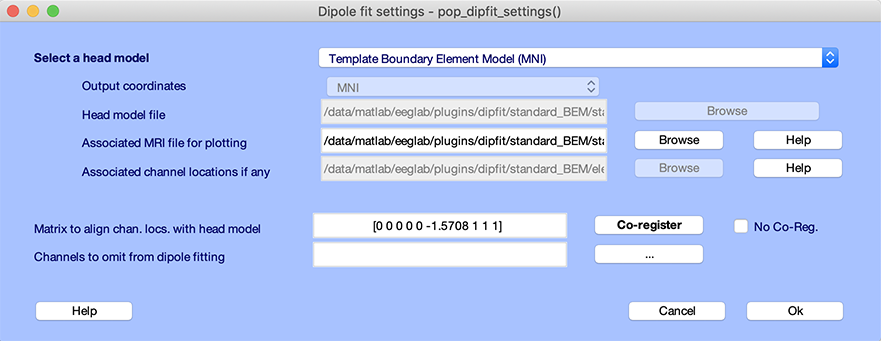
Before running DIPFIT, we must select a head model. Select the EEGLAB menu item Tools → Locate dipoles using DIPFIT → Head model and settings, as shown below. Press Ok to use all defaults. For additional information on this topic, see the head model selection section of the tutorial.
Select components of interest
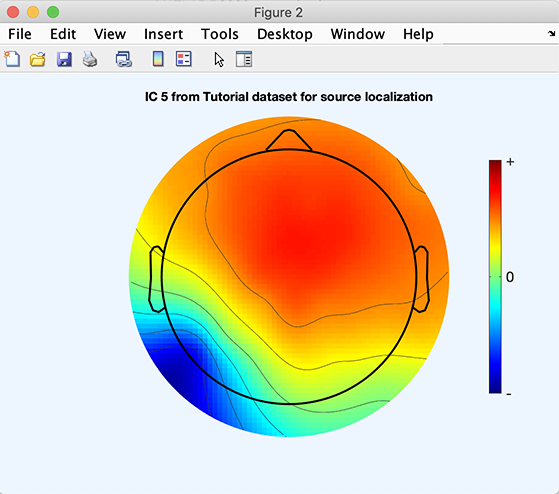
Next, you must select which component to fit. Independent component (IC) 5 of the sample dataset decomposition is a typical left posterior alpha rhythm process. To plot component scalp map, use menu item Plot → Component maps → In 2-D, enter 5 for the component number. Press Ok.
There are two steps required to create equivalent dipole models for independent components:
- Grid scanning: This involves scanning possible positions in a coarse 3-D grid to determine an acceptable starting point for fitting equivalent dipoles to each component.
- Non-linear interactive fitting: This involves running an optimization algorithm to find the best position for each equivalent dipole.
Below we describe these steps in detail. Note that the grid scanning and non-linear optimization may also be performed automatically for a group of selected components. This is described later in this tutotial.
Initial fitting - Scanning on a coarse-grained grid
Before you perform interactive dipole fitting, use DIPFIT to scan for the best-fitting dipole locations on a coarse 3-D grid covering the whole brain. The solutions of this grid search are not very accurate yet, but they are acceptable as starting locations for the non-linear optimization. Starting from these best grid locations will speed up finding the final best-fitting solution. To scan dipoles on a coarse grid, select the Tools → Locate dipoles using DIPFIT → Coarse fit (grid scan) menu item. The window below will pop up:
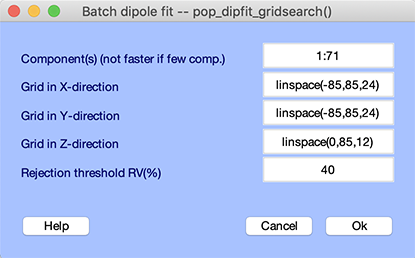
The first edit box Component(s) allows you to select a subset of components to fit. Selecting only a few components does not increase computation speed since the forward model still has to be computed at each location on the grid. The Grid in X-direction,Grid in Y-direction, and Grid in Z-direction edit boxes allow you to specify the size and spacing of the coarse grid. By default, DIPFIT uses 24 steps equally spaced between -radius and +radius of the sphere that best matches the electrode positions. Since equivalent dipoles are not likely to be in the lower hemisphere of the model head, by default DIPFIT only scans through positive Z values. The last edit box, Rejection threshold RV(%), allows you to set a threshold on the maximum residual variance that is accepted. Using this threshold, components that do not resemble a dipolar field distribution will not be assigned a dipole location. Press Ok to continue.
Progress of the coarse grid scanning is shown on the MATLAB command window. During dipole localization, the electrode positions are projected to the skin surface of the spherical or BEM head model, though the electrode positions of the dataset are not altered. DIPFIT starts the grid scan by first excluding all 3-D grid locations that are outside the head. It then computes the forward model (dipole-to-electrode projections) at each remaining grid location and compares it with all component topographies.
Plotting dipole locations in 3-D volume
When the process is completed, select the Tools → Locate dipoles using DIPFIT → Plot component dipoles menu item to call the GUI below:
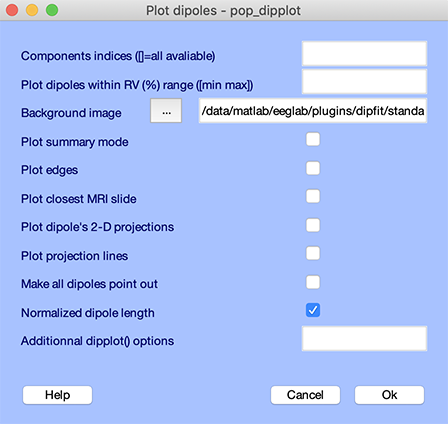
Simply press Ok to produce the figure below:
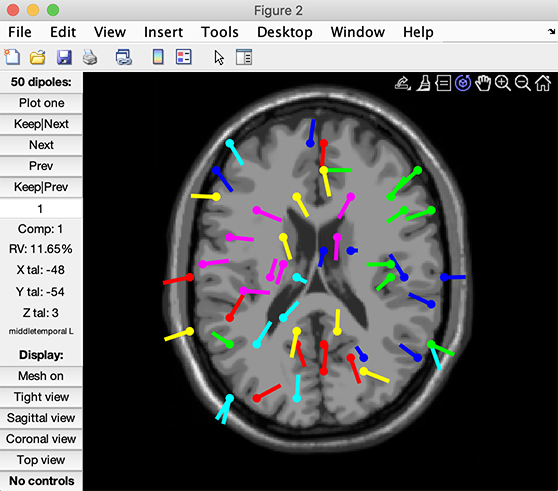
Here, all the dipoles plotted had a residual variance (vis a vis their component maps) below 40% (as we specified in the coarse grid search interactive window). Note that some components end up having the same x, y, and z coordinates because of the coarseness of the grid. You may view individual components by pressing the Plot one button. The component’s residual variance is indicated under its number.
Plotting dipole locations on scalp maps
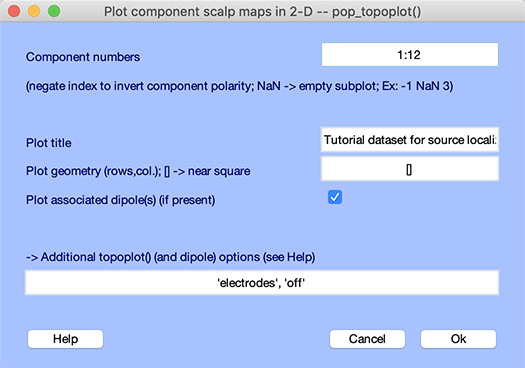
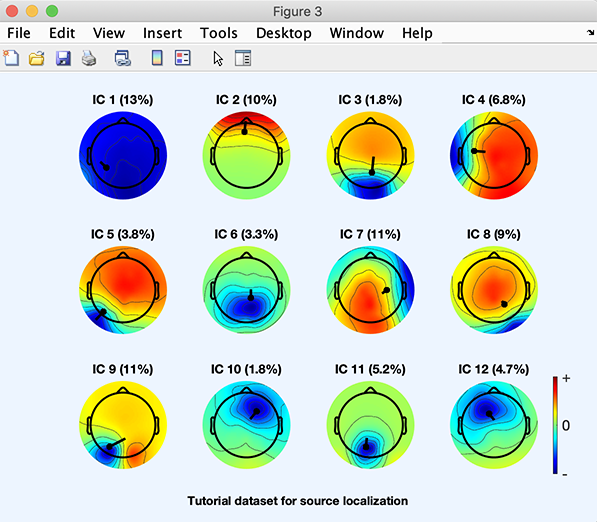
Select menu item Plot → Component maps → In 2-D, enter 1:12 in the Component numbers edit box to only plot the first 12 components. Check the checkbox to plot associated dipoles and press Ok.
The following plot will pop up. 2-D projections of component associated dipoles are overlaid on components’ scalp topographies. Components’ residual variance (in percent) are indicated next to their number.
Interactive fine-grained fitting
To scan dipoles interactively, call the Tools → Locate dipoles using DIPFIT →Fine fit (iterative) menu item. The following window pops up. Enter a component index (here, 5) in the Component to fit edit box.
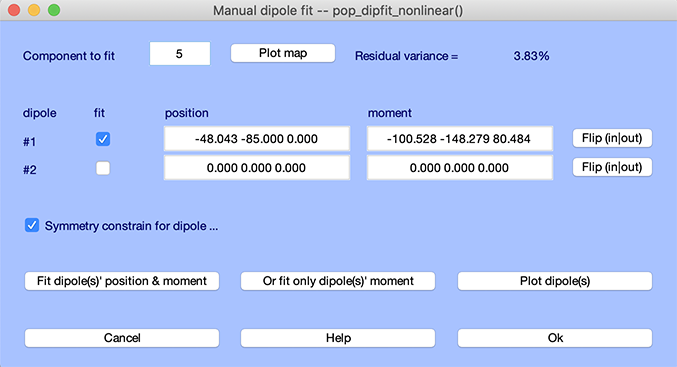
Prior to fitting this component, press the Plot map button to show the component scalp map. Then press the Fit dipole(s) position & moment button to perform fine fitting. Press the Plot map button again. The two scalp topographies are shown below (left, before fine fitting; right, after fine fitting). The residual variance decreases from 3.8% to 3%.
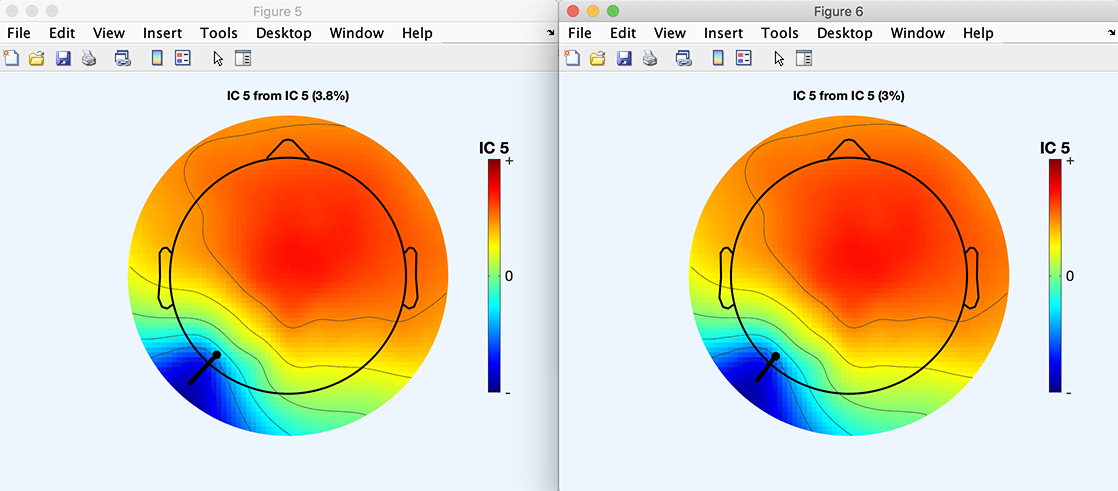
Note that the polarity of components is not fixed (but their orientation is): the product of the component scalp map value and the component activation value (i.e., the back-projected contribution of the component to the scalp data) is in the original data units (e.g., microvolts), but the polarities of the scalp map and of the activation values are undetermined. For example, you may multiply both the scalp map and the component activity by -1 while preserving the component back-projection to the scalp (since the two negative factors cancel out). As a result, you may choose to flip the visualized dipole orientations: use the pop-up window for fitting, then press the Flip in|out button and then the Plot dipole(s) button to re-plot the dipoles with indicated orientations reversed.
Important note: When you are done, press the Ok button in the interactive dipole fitting interface. Do not press Cancel or close the window – if you do, all the dipole locations computed using this interface will be lost!
Fitting symmetrical dipoles
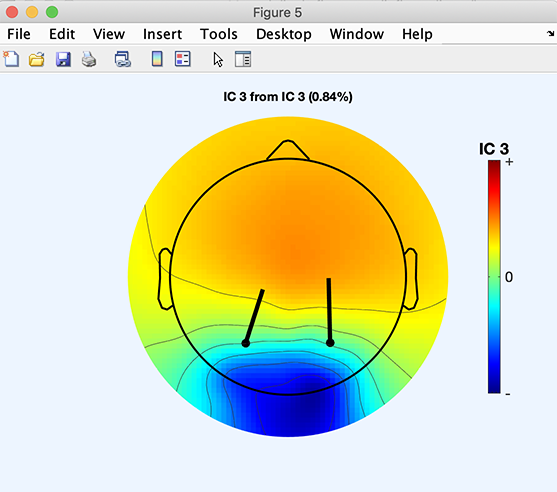
Select component 3 and press the Plot map button to visualize this component. This component, showing a clear left-right symmetric activity, cannot be accurately modeled using a single dipole. To fit this component using two dipoles constrained to be located symmetrically across the (corpus callosum) midline, set both dipole 1 and 2 to ‘active’ and ‘fit’ (by checking the relevant checkboxes in the GUI). Then press the Fit selected dipole position(s) button. If fitting fails, enter different starting positions (e.g., [-10 -68 17] for first dipole and [10 -68 17] for the second dipole and refit).
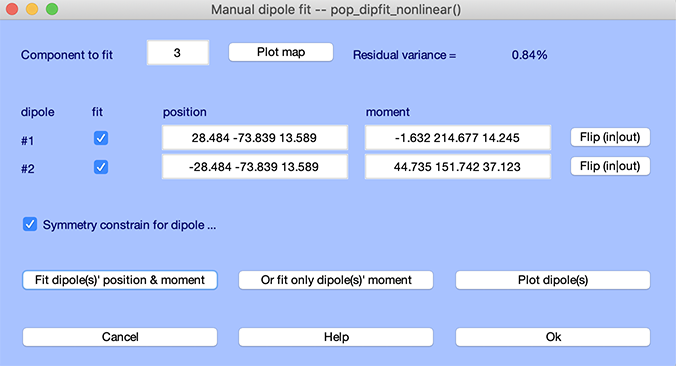
Press the Plot map button. When dipole fitting is done, note the low residual variance for the two-dipole model on the top right corner of the interactive interface.
Automated dipole fitting
Automated dipole fitting performs the grid search and the non-linear fitting on several components without human intervention. To find a best-fitting equivalent dipole for component of your choice, select the EEGLAB Tools → Locate dipoles using DIPFIT → Autofit (coarse fit, fine fit, plot) menu item. Set the Component indices to 5, enter 100 in the rejection threshold edit box so the iterative solution is computed regardless of the residual variance for the coarse fit, and check the Plot resulting dipoles checkbox to plot component dipoles at the end dipole fitting. Then, press Ok.
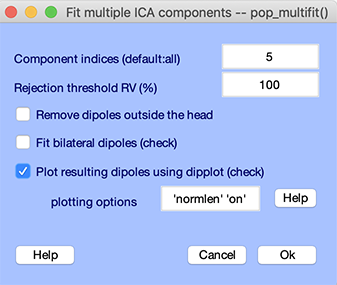
The function starts by scanning a 3-D grid to determine acceptable starting positions for each component. Then it uses the non-linear optimization algorithm to find the exact dipole position for each component. At the end of the procedure, the following window pops up.
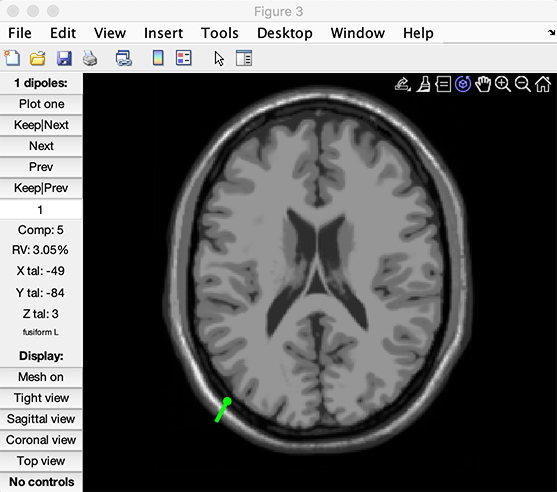
The dipplot.m function above allows you to rotate the head model in 3-D with the mouse, and plot MRI slices closest to the equivalent dipole as shown in the following sections.
Advanced visualization of dipole models
Use the Tools → Locate dipoles using DIPFIT → Plot component dipoles menu item and select component numbers 3 and 5 (assuming you performed the fit for both components 3 and 5 as described above). Select all options as shown below.
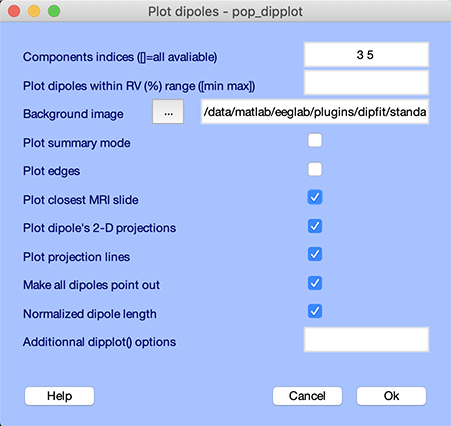
The following plot pops-up.
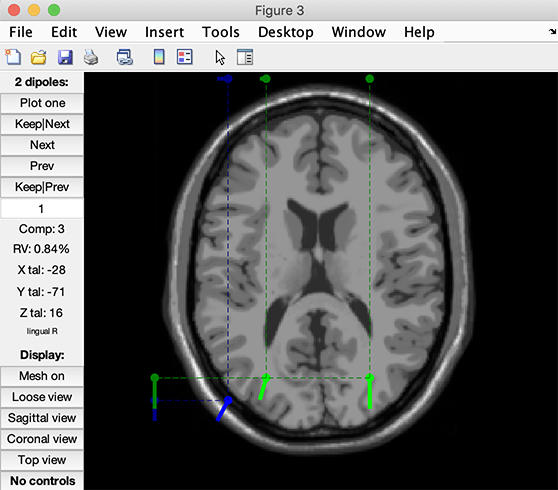
Press the Plot one button. You may scroll through the components by pressing the Next/Prev buttons. Note that the closest MRI slices to the dipole being currently plotted are shown. Note also that if you do not select the option Plot closest MRI slices in the graphic interface, and then press the Tight view button in the dipplot window, you will be able to see the closest MRI slices at the location of the plotted dipole as shown below. Try moving the 3-D perspective of the tight view plot with the mouse and/or selecting the three cardinal viewing angles (sagittal, coronal, top) using the lower-left control buttons.
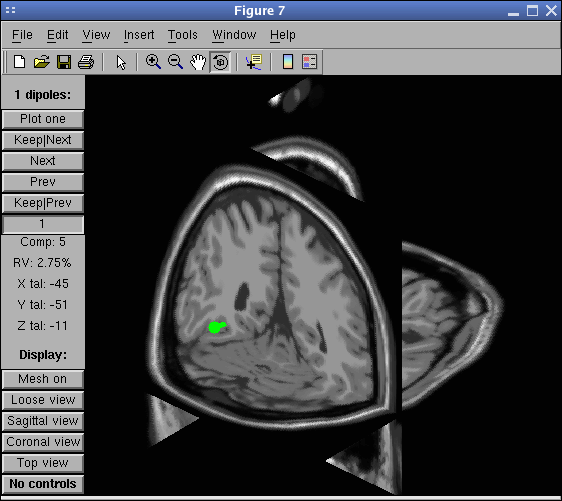
Note that it is not possible to toggle the dipole “stems” or “projection lines” on and off from within the graphic interface. Instead, use the EEGLAB menu item again and unselect the corresponding checkbox.
Finally, again call menu item Tools → Locate dipoles using DIPFIT → Plot component dipoles. Select Summary mode and press Ok.
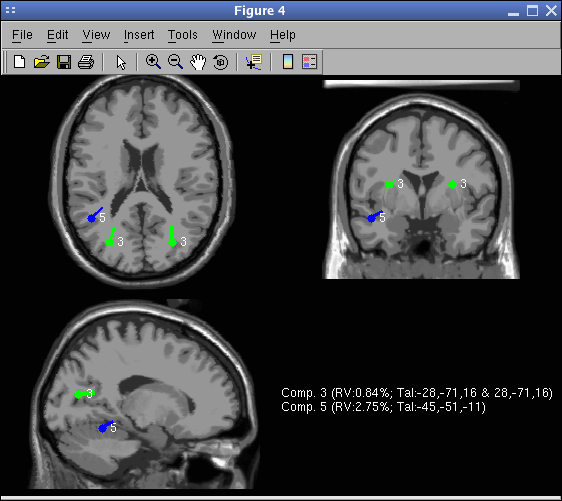
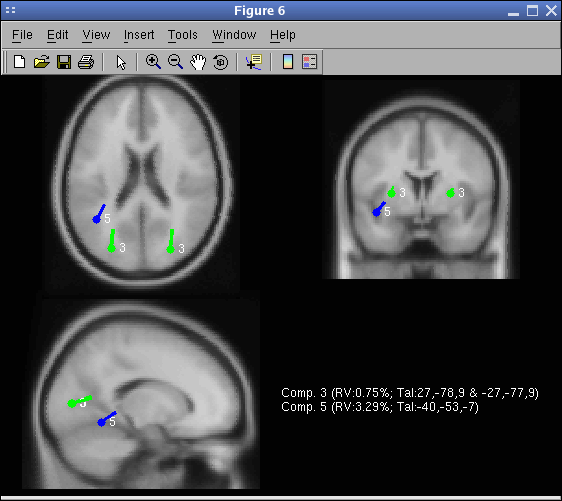
For comparison, using the spherical model, the location of the dipoles would have been as shown in the following picture (to obtain this picture, select the spherical head model and redo dipole fitting). Notice the similarity of the Talairach coordinates for the two models. Notice also that the BEM model does not overestimate dipole depth compare to the spherical model (which is usually the case when the BEM model mesh is too coarse). The MRI used to plot the spherical result is the average MNI brain (over about 150 subjects), whereas the MRI used to plot the BEM is the average MNI brain of a single subject (which was used to generate the model leadfield matrix).
The entry Background image contains the name of the MRI in which to plot dipoles. You may enter the subject’s MRI assuming you have normalized it to the MNI brain. The SPM software will take a raw subject MRI as input and normalize it to the MNI brain template.
eLoreta using DIPFIT
DIPFIT also allows computing eLoreta solutions for ICA components. Model settings and coregistration with head model are the same for eLoreta as for dipole source localization.
If you have not done so already, load the eeglab_dipole.set tutorial dataset in EEGLAB. Select menu item File → load existing dataset and select the tutorial file “eeglab_dipoles.set” downloaded above. Then press Open.
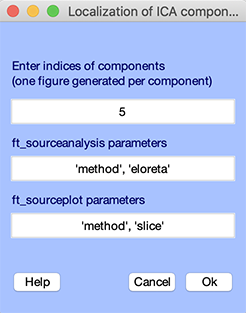
eLoreta source localization may be performed using the File →Locate component using eLoreta menu item. Enter component 5 and press Ok.
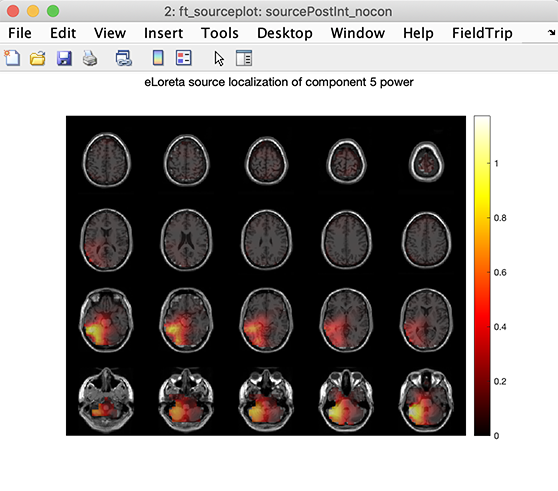
Result for this component is shown below. Like other DIPFIT functions, eLoreta relies on FieldTrip functions. Refer to the FieldTrip ft_sourceanalysis.m function help message for more information on eLoreta source localization.
Using DIPFIT to fit independent MEG components
It is possible to use DIPFIT to fit MEG components. This other section of the tutorial contains more details on using EEGLAB to process MEG data.
DIPFIT structures and functions
Like other EEGLAB functions, DIPFIT functions are standalone and may also be called from the command line. Note that whenever you call some of the DIPFIT menu items from EEGLAB, a text command is stored in the EEGLAB history as for any other EEGLAB menu item. The two DIPFIT menu items that generate an EEGLAB history command that can be re-used in batch scripts are Tools → Locate dipoles using DIPFIT → Autofit and Tools → Locate dipoles using DIPFIT → Head model and settings. Type eegh on the MATLAB command line to view the command history.
DIPFIT creates a EEG.dipfit sub-structure within the main EEG dataset structure. This structure has several fields:
EEG.dipfit.hdmfile Model file name. Contains information about the geometry and the conductivity of the head. This is a standard MATLAB file and may be edited as such. EEG.dipfit.mrifile Contains the MRI file used for plotting dipole locations. EEG.dipfit.chanfile Contains the template channel location file associated with the current head model. This is used for electrode co-registration. EEG.dipfit.coordformat Contains the coordinate format in the model and MRI structure. This is “spherical” for the spherical model or “MNI” for the BEM model. MNI means that the coordinates will be rotated by 45 degree EEG.dipfit.coord_transform Contains the Talairach transformation matrix to align the user dataset channel location structure (EEG.chanlocs) with the selected head model. This is a length-9 vector [shiftx shifty shiftz pitch roll yaw scalex scaley scalez]. Type >> help traditionaldipfit in MATLAB for more information. EEG.dipfit.chansel Array of selected channel indices to fit (for instance, ECG or EYE channels might be excluded). EEG.dipfit.model A structure array containing dipole information. EEG.dipfit.model.posxyz Contains the 3-D position of the dipole(s). If a two-dipole model is used for a given component, each row of this array contains the location of one dipole. EEG.dipfit.model.momxyz Contains 3-D moment of the dipole(s). If a two-dipole model is used for a given component, each row of this array contains the moment of one dipole. EEG.dipfit.model.rv Gives the relative residual variance between the dipole potential distribution and the component potential distribution, ranging from 0 to 1. EEG.dipfit.model.active Remembers which dipole was active when the component model was last fitted. EEG.dipfit.model.select Remembers which dipole was selected when the component model was last fitted. EEG.dipfit.current Index of the component currently being fitted.
The main DIPFIT functions which can be called from the command line in batch mode are:
- pop_dipfit_settings.m: Specify DIPFIT parameters, i.e. head model details.
- pop_multifit.m: Command the DIPFIT modeling process from a single function. This function allows the user to set parameters, initialize locations on a coarse grid, then perform non-linear optimization. This function can be used to automate batch fitting of components from one or more subjects.
Auxiliary DIPFIT functions used by the functions above:
- dipfitdefs.m: Defines a set of default values used in DIPFIT.
Literature references
M. Scherg, “Fundamentals of dipole source potential analysis”. In: “Auditory evoked magnetic fields and electric potentials” (eds. F. Grandori, M. Hoke and G.L. Romani). Advances in Audiology, Vol. 6. Karger, Basel, pp 40-69, 1990.
R. Kavanagh, T. M. Darcey, D. Lehmann, and D. H. Fender. “Evaluation of methods for three-dimensional localization of electric sources in the human brain.” IEEE Trans Biomed Eng, 25:421-429, 1978.
T.F. Oostendorp and A. van Oosterom, “Source parameter estimation in inhomogeneous volume conductors of arbitrary shape”, IEEE Trans Biomed Eng. 36:382-91, 1989.