Quickstart guide
This page lets you import and visualize an EEG dataset. It is a way to get started quickly.
Load the sample EEGLAB dataset
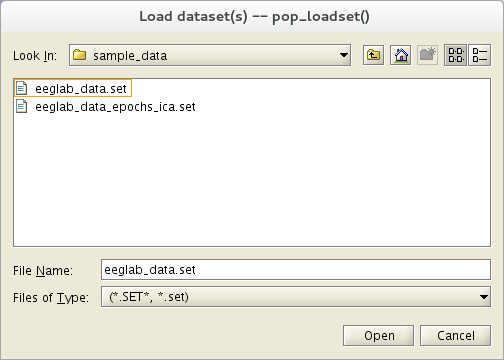
Select menu item File and press sub-menu item Load existing dataset.
In the rest of the tutorial, we will use the convention: Menu_item → Submenu_item to refer to a menu selection (e.g., here select submenu item Load existing dataset under the top-level File submenu).
In Unix, the following window will pop up (the aspect ratio of this window may differ in Windows and MacOS):
To learn how to create EEGLAB datasets from your data, see the tutorial on Importing data and data events.
Select the tutorial file “eeglab_data.set”, which is distributed with the toolbox, located in the “sample_data” folder of EEGLAB. Then press Open.
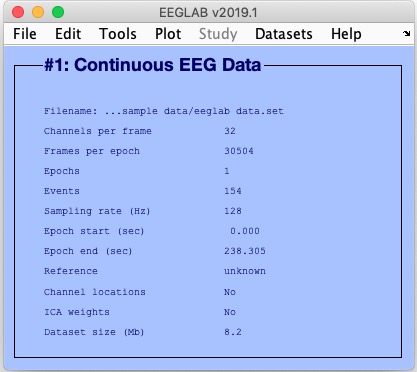
After EEGLAB loads the dataset, the main EEGLAB window shows relevant information about it – its number of channels, sampling rate, etc.
Exploring event values
In the tutorial dataset, the EEG.event structure fields type, position, and latency are specified for each of the 154 events marked in the dataset.
Select menu Edit → Event Values to call up a window where we can read and edit these values:
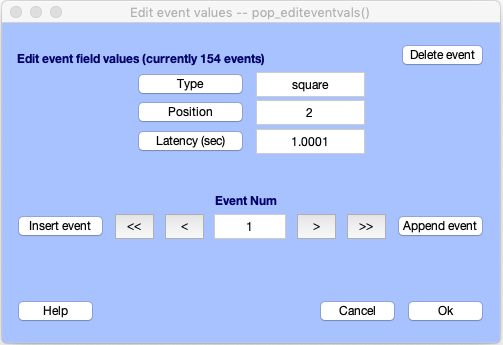
Scroll through each event by pressing the < and > buttons, or in steps of 10 using << and >>.
We will now briefly describe the experiment that produced the sample dataset to motivate the analysis steps we demonstrate in the rest of the tutorial.
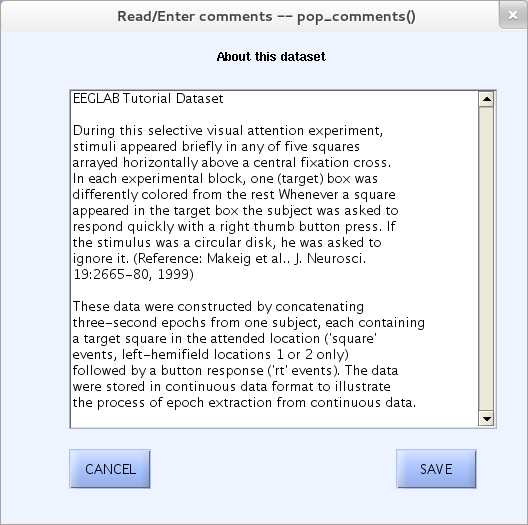
About this dataset
Here we describe how to edit and view the text field, which describes the current dataset and is stored as a part of that dataset.
Select Edit → About this dataset. A text-editing window pops up, which allows the user to edit a description of the current dataset. For the sample data, we entered the following description of the task. Press SAVE when done.
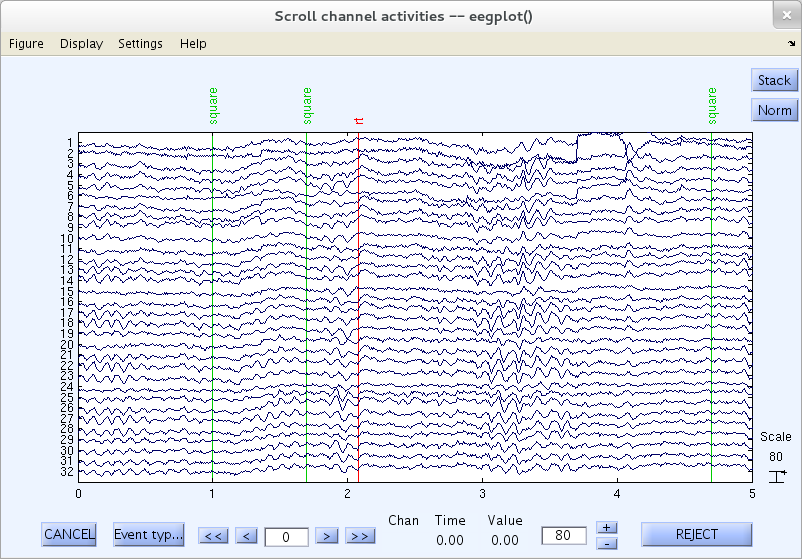
Scrolling through the data
Here we learn how to visualize and to reject selected portions of continuous EEG channel data.
To scroll through the channel data of the current dataset, select Plot → Channel data (scroll). This pops up the eegplot.m the scrolling data display window below.