In the between subjects’ ANOVA with repeated factor, we artificially split subjects into young and old subjects. Such post-hoc splitting is not recommended and typically create spurious results. Instead, we could test how much age influences face perception. For this, we will use the contrast faces vs scrambled computed previously in the one-sample t-test.
You can either create the age variable from the participants.tsv file, or we can load values from STUDY. Don’t worry about the missing values, LIMO will simply remove those subjects for which there are no values.
In command window type:
age_regressor = cell2mat(arrayfun(@(x) x.age,STUDY.datasetinfo,'UniformOutput',false))';
save('age_regressor.mat','age_regressor')
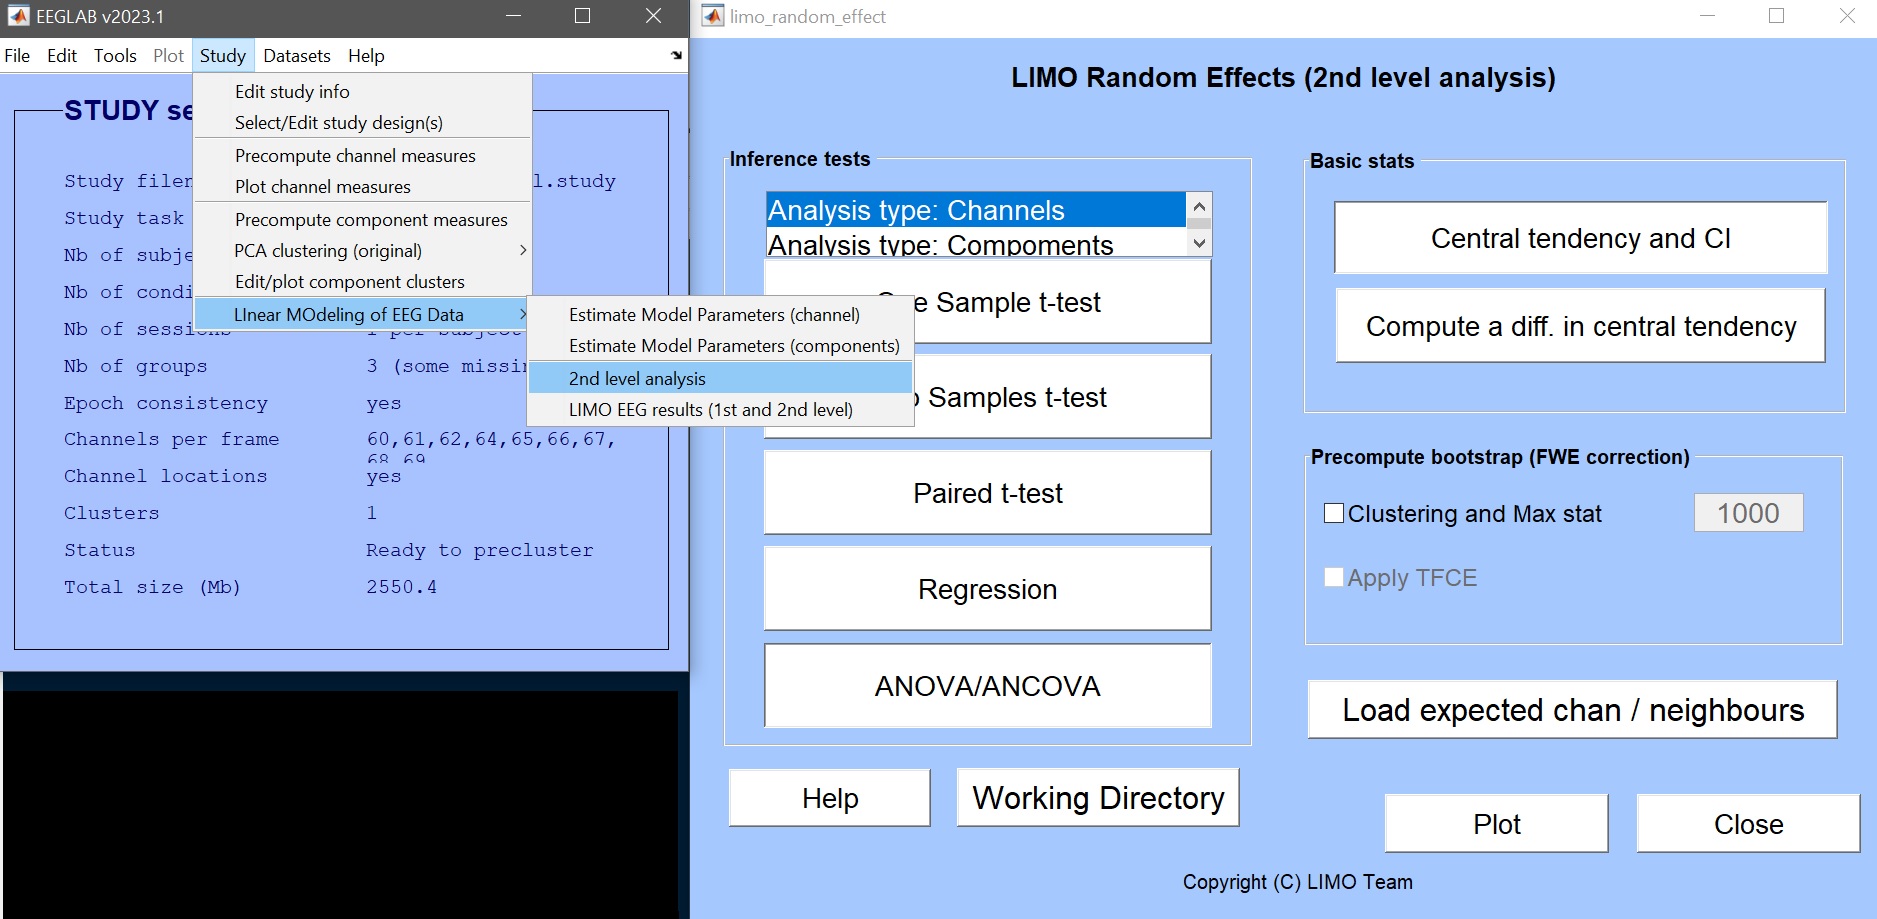
From the second level GUI (figure 9), select regression, full scalp analysis and pick-up the contrast faces>scrambled computed for one-sample t-test (should be con4), finally select the age_regressor.mat we just created (figure 40). WARNING: it is suggested to set the bootstrap to 0 as this is very long to compute since we use here an Iterative Reweighted Least Squares (IRLS) solution that weights subjects for each electrode and time frame.
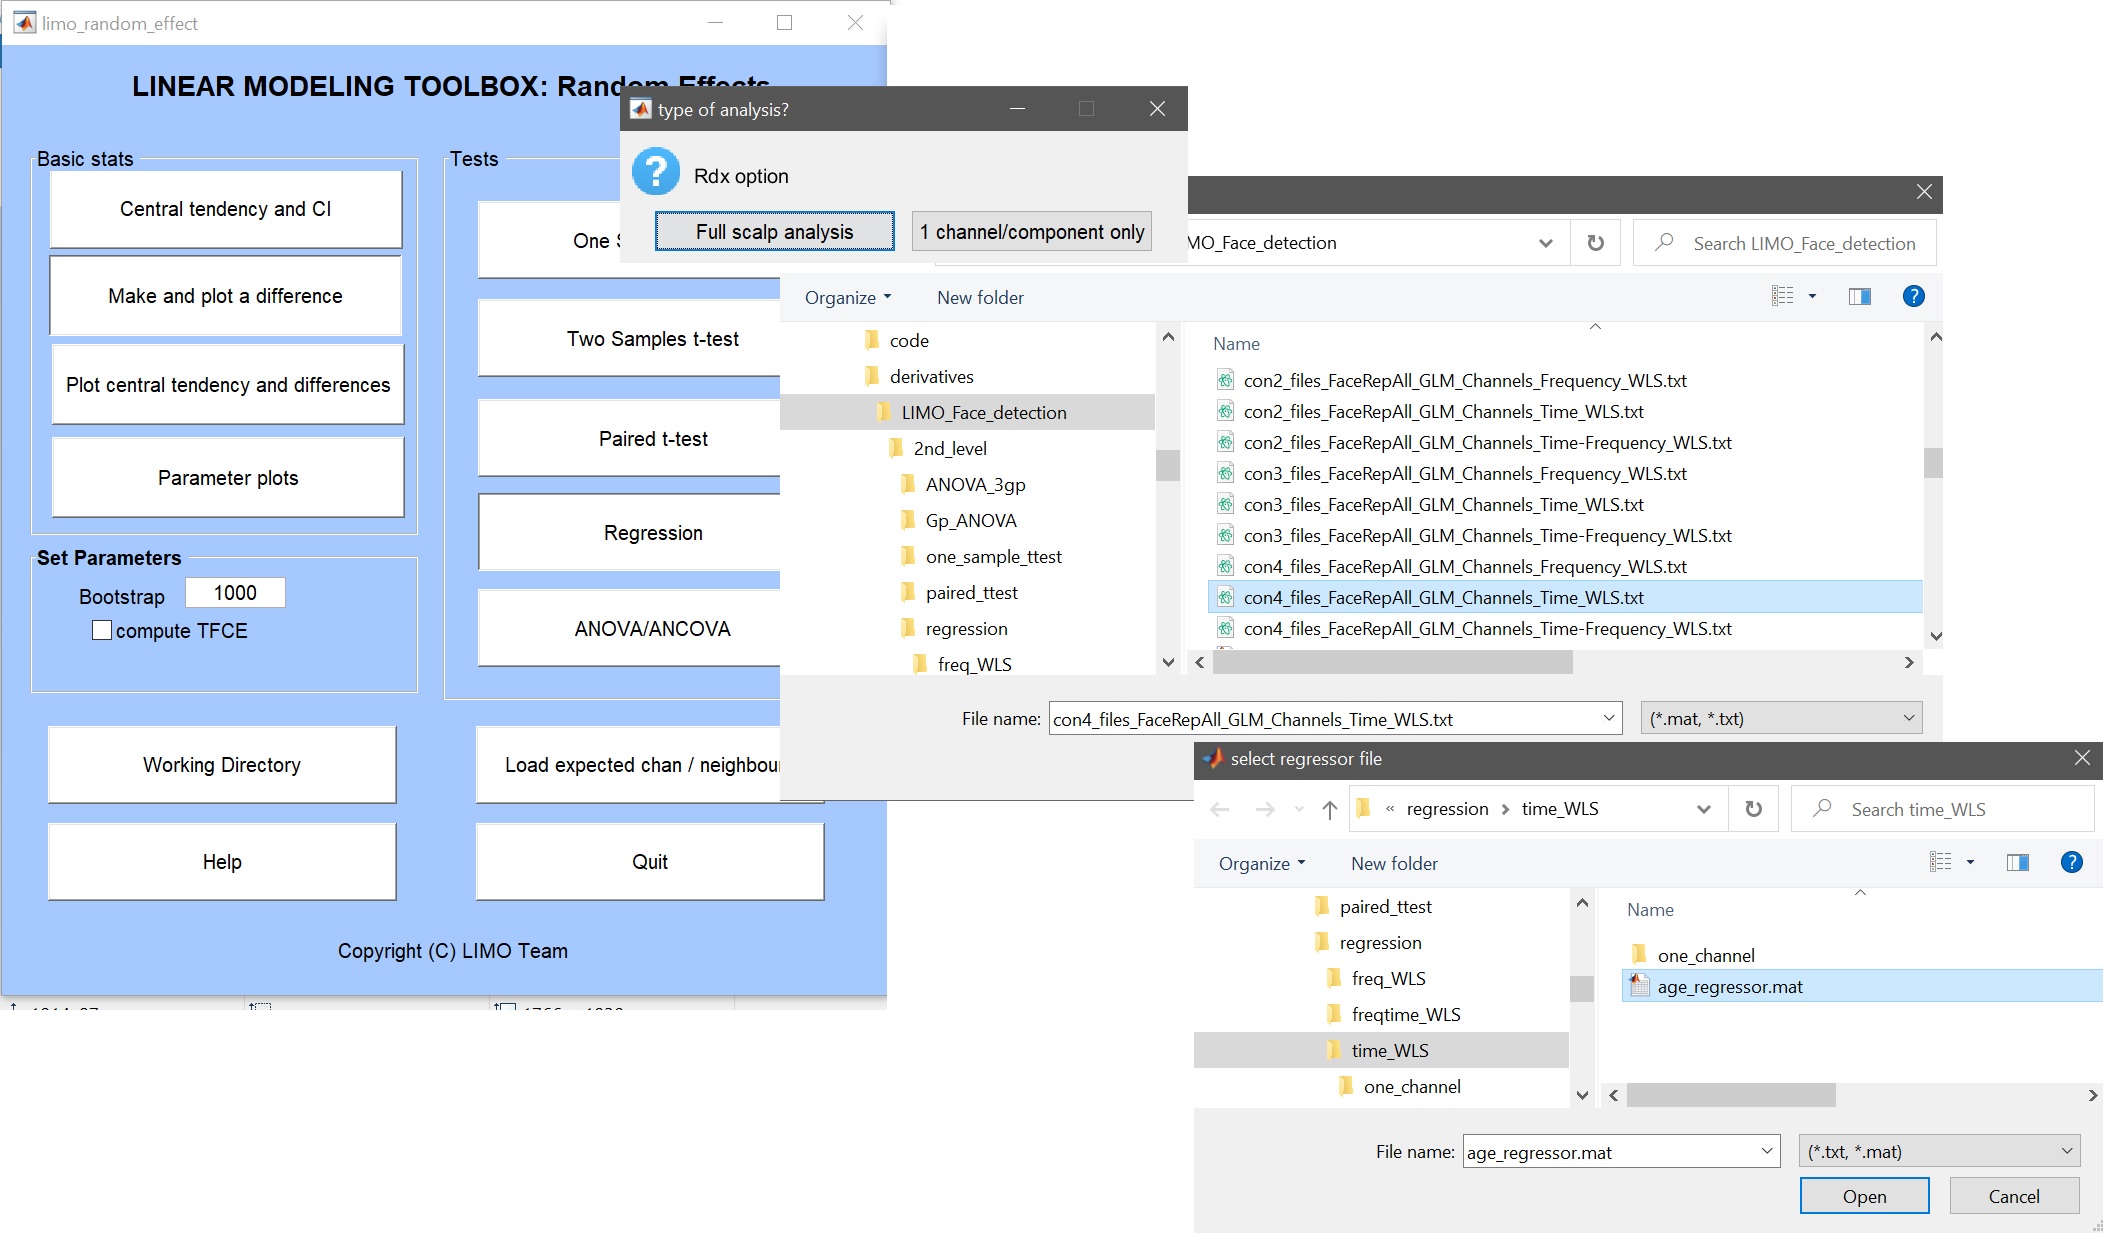 Figure 40. Create a 2nd level regression analysis with age.
These steps can be executed in command line as:
chanlocs = XXX\derivatives\limo_gp_level_chanlocs.mat';
LIMOPath = limo_random_select('regression',chanlocs,'LIMOfiles',...
    'XXX\LIMO_Face_detection\con4_files_FaceRepAll_GLM_Channels_Time_WLS.txt', ...
    'analysis type','Full scalp analysis', type','Channels','nboot',0,'tfce',0,'regressor',...
    'XXX\LIMO_Face_detection\2nd_level\regression\age_regressor.mat',...
    'zscore','Yes','skip design check','Yes')
Results can be appreciated using ‘image all’ and ‘course plot’. Here, because we have a continuous variable we can visualize how subjects data vary along with the variable of interest (figure 41 for ERP, Spectrum, ERSP). You can either look at the raw data, modelled (best option here) or adjusted.
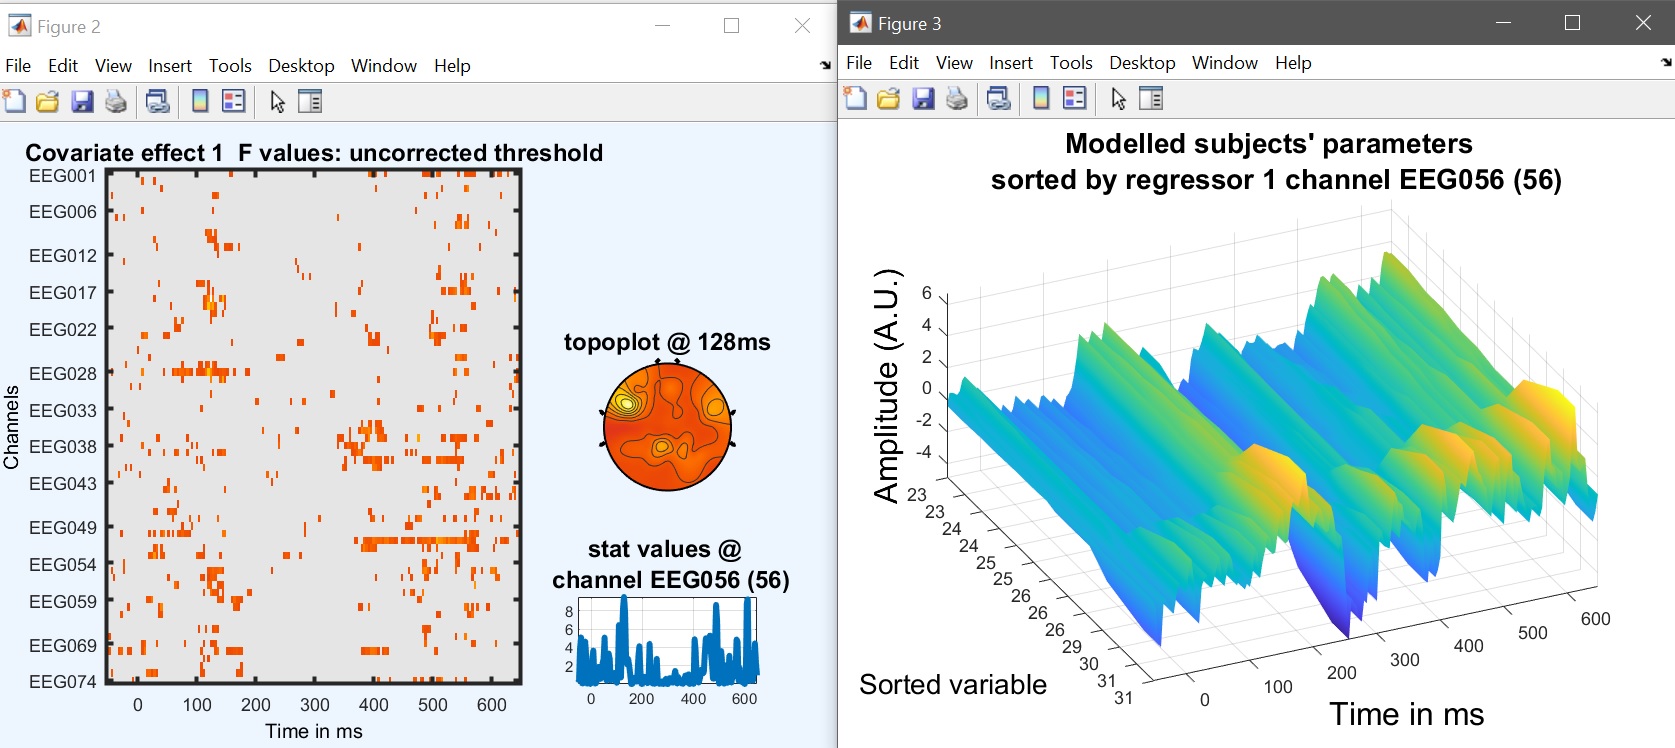
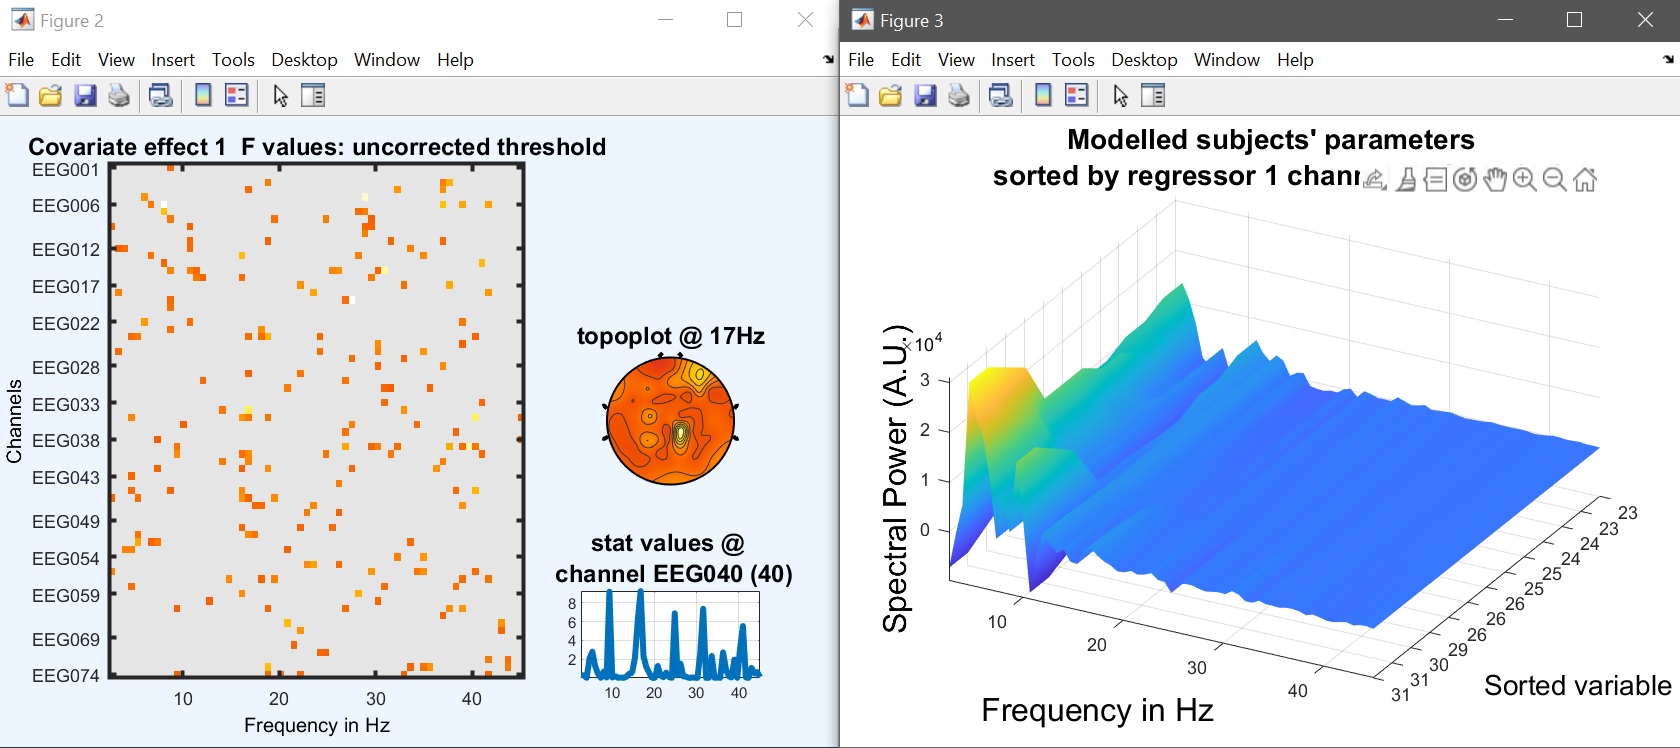
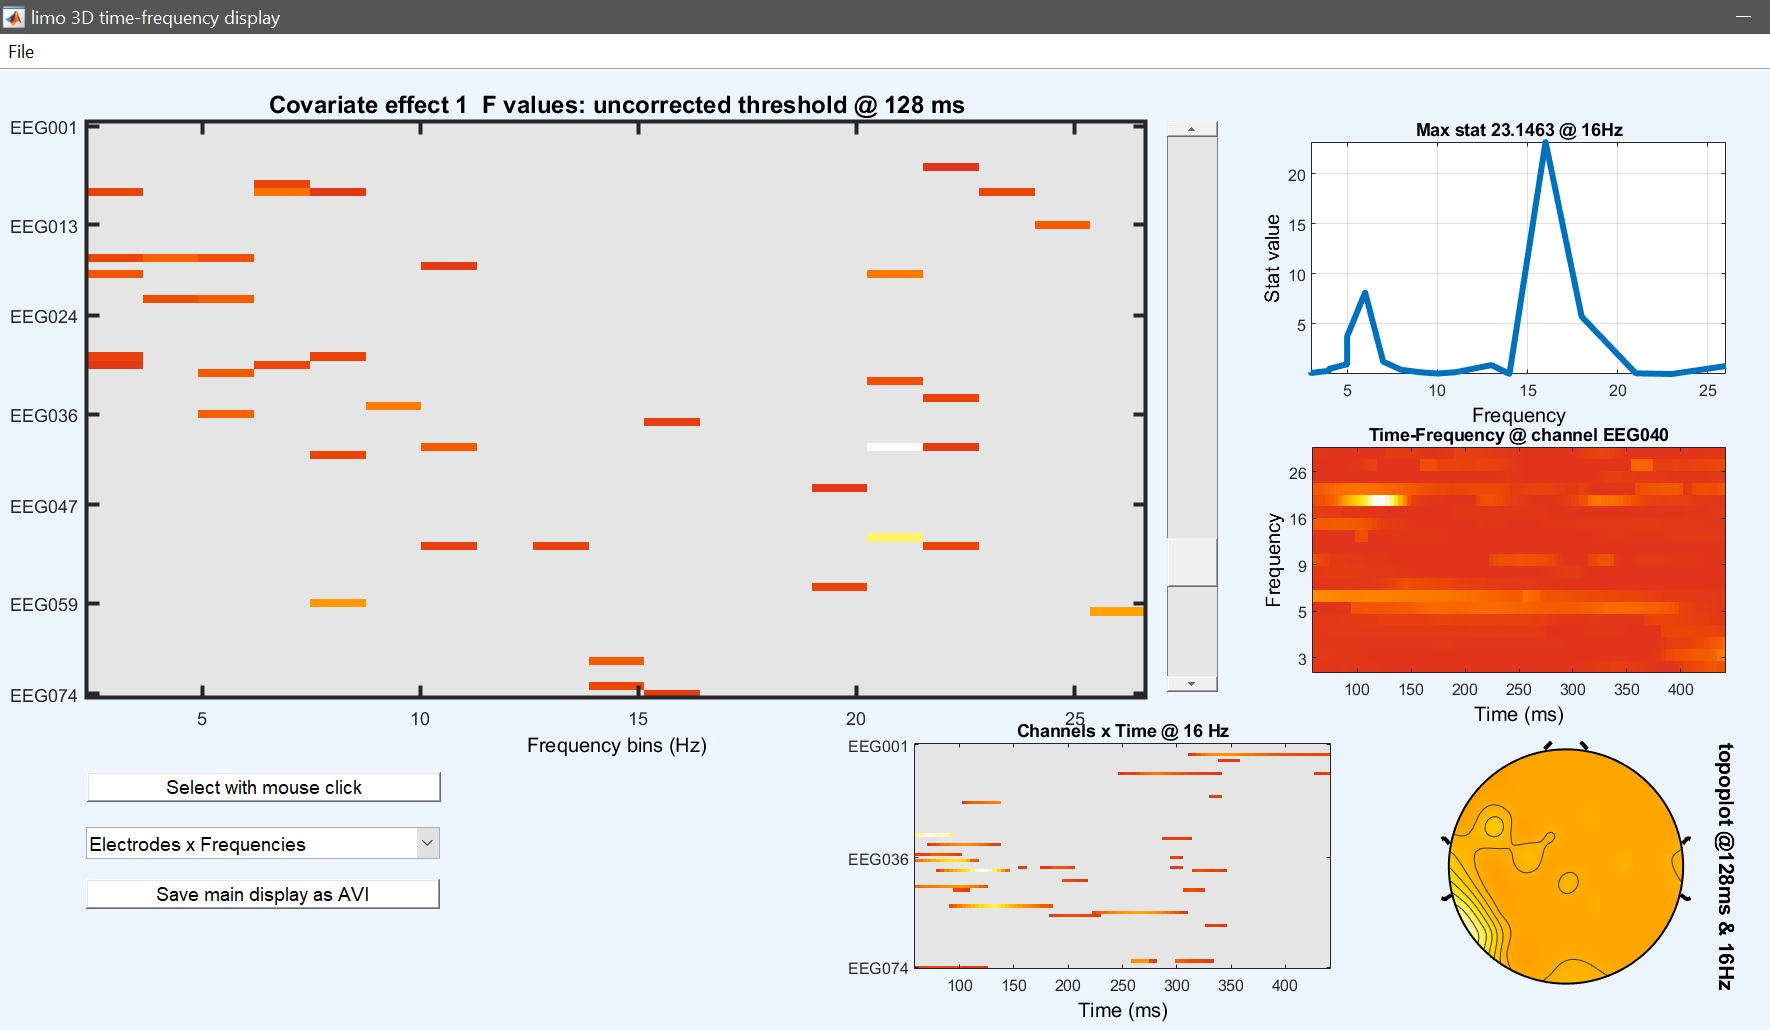 Figure 41. Results of the regression analysis of age on the contrast faces>scrambled.