Creating EEGLAB plugins and extension
This section about creating plugins and extension is fairly long. However, creating an EEGLAB plugin is very simple. If you are in a rush, jump to the example section and copy and paste code.
Table of contents
How to write EEGLAB functions
EEGLAB function encapsulation
EEGLAB operates in the rich MATLAB environment. The structure of EEGLAB functions makes it easy to combine them in new ways in original MATLAB scripts that can also incorporate any of the wide variety of processing tools and methods available in MATLAB. Thus, the straightforward way to add to EEGLAB capabilities is to use EEGLAB functions and data structures within your MATLAB scripts, something many or most EEGLAB users do routinely.
EEGLAB functions provide a level of encapsulation and isolation that minimizes the possibility of interference between variable names within and outside of the functions themselves, e.g., in MATLAB scripts or functions that may call them. EEGLAB is, in essence, a large set of MATLAB functions.
Adding new functionality to EEGLAB requires a pair of functions, a signal processing function (Ex: sample.m), and an accompanying pop_ function (Ex: pop_sample.m). The pop_ function pops up a text input window allowing the user to specify arguments to the signal processing function. The MATLAB help messages for each function should state clearly what input arguments the functions require and what they output, using the help message format explained below. You should read the EEGLAB function section of the tutorial to understand the different levels of functions in EEGLAB.
Signal processing functions
Functions that directly operate on EEG data fields should comply with the EEGLAB help-message syntax EEGLAB users are familiar with. For example, see this sample header.
Associated pop_ functions
A pop_ function associated with a signal processing function creates a graphic user interface to it. The pop_ function (the whole name should begin with pop_ followed by the name of the signal processing function) should include the same disclaimer as the signal processing function and
- It must take the EEGLAB data structure ‘EEG’ as a first input. Optionally, the function’s second parameter may specify whether the signal processing function will be applied to ICA component activations or the raw EEG data channels.
- Additional parameters should be optional. If they are left blank in a command line or script call to the pop_ function a MATLAB window should pop-up to ask for their values.
- The pop_ function must return a ‘string’ containing the resulting call to the signal processing function (or, in some cases, to the pop_ function). When this string is evaluated using the MATLAB function eval, the result must be the same as that of the pop_ function itself, e.g., including all the parameters the user may have entered into the pop-up interface window. This string will be pushed into the EEGLAB command history stack.
- By convention, if the function draws a figure, calling the function without enough arguments should pop up a new figure. However, given enough arguments, the function should directly draw the output graphic in the current figure (thus allowing the user to build multi-part figures, e.g., using the sbplot command). Writing a pop_ function is easy and can usually be done in a few minutes if you modify this pop_sample.m function source.
How to debug EEGLAB functions
When called from the EEGLAB GUI, EEGLAB intercepts errors, which can make it challenging to debug functions. The solution is to call the function from the command line (preceded by dbstop if error), and EEGLAB will not intercept the error.
Using EEGLAB GUI design functions
The function supergui.m is the main function used for creating graphic interfaces in EEGLAB. We will be describing below some basic and more advanced uses for it:
Using the supergui function
The supergui.m was designed to alleviate the burden of manually creating a graphic interface for each function. Instead, a series of controls are defined along with their approximate locations and the figure is automatically created. An example is shown below:
  supergui( 'geomhoriz', { 1 1 1 }, 'uilist', { ...
         { 'style', 'text', 'string', 'Hello!' }, { }, ...
         { 'style', 'pushbutton' , 'string', 'OK' } } );
This creates the following graphic interface
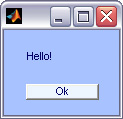
The command-line call above contains two main arguments: ‘geometry’ and ‘uilist’. ‘geometry’ defines the geometry in this case 3 lines { 1 1 1 } (see more complex geometry below). The ‘uilist’ defines the content for each of these lines. The first line contains some text “{ ‘style’, ‘text’, ‘string’, ‘Hello!’ }”. The second line is empty “{ }” and the third line contains the “OK” button “{ ‘style’, ‘pushbutton’ , ‘string’, ‘OK’ }”.
However, if you press Ok, nothing will happen because no action has been associated with this button. To associate an action to a UI control, simply use the ‘callback’ command and enter any MATLAB command in the associated string parameter.
  supergui( 'geomhoriz', { 1 1 1 }, 'uilist', { ...
         { 'style', 'text', 'string', 'Hello!' }, { }, ...
         { 'style', 'pushbutton' , 'string', 'OK' 'callback' 'close(gcbf);' } } );
Above, we added the ‘callback’ command “close(gcbf)” which closes the current figure when users press the Ok button.
Almost any geometry (but not all as detailed in the advanced section) may be defined using this scheme. For instance
  supergui( 'geomhoriz', { [1 1] 1 1 }, 'uilist', { ...
         { 'style', 'text', 'string', 'Enter some text' }, ...
         { 'style', 'edit', 'string', 'Hello!' }, { }, ...
         { 'style', 'pushbutton' , 'string', 'OK' 'callback' 'close(gcbf);' } } );
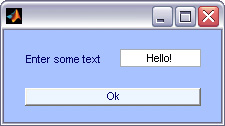
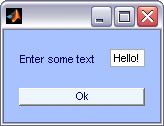
The first line now has geometry [1 1], which means that two UI will share this line and have the same horizontal extent. As shown below, changing [1 1] to [1 0.5] forces the second UI on the line to have only half the horizontal extent of the first one.
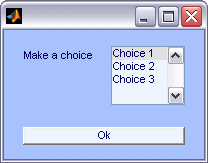
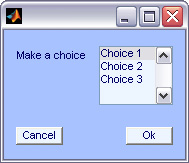
In some cases, it is convenient to have a UI spam more than one line of text. This is often the case for listbox UI, for instance. Below we define a listbox UI with multiple choice and use the additional command ‘geomvert’ to specify the vertical geometry. It is set to [3 1 1], which means that the UI on the first line will span 3 lines of text, and the other lines will only span one line of text (we have to add carriage returns - character 10 - to the text of the first UI so this text is aligned with the listbox UI).
  supergui( 'geomhoriz', { [1 1] 1 1 }, 'geomvert', [3 1 1], 'uilist', { ...
         { 'style', 'text', 'string', [ 'Make a choice' 10 10 10 ] }, ...
         { 'style', 'listbox', 'string', 'Choice 1|Choice 2|Choice 3' }, { }, ...
         { 'style', 'pushbutton' , 'string', 'OK' 'callback' 'close(gcbf);' } } );
Using the inputgui function
Although supergui.m can be useful, it only creates the GUI, and all the control flow of events needs to be handled by the UIs; i.e., creating a button Ok, a button Cancel and handling the events associated to these buttons are left to the user. The inputgui.m function (which calls the supergui.m function) helps supplement this by automatically creating these buttons and also by processing outputs. For instance:
  res = inputgui( 'geometry', { [1 1] }, ...
         'geomvert', [3], 'uilist', { ...
         { 'style', 'text', 'string', [ 'Make a choice' 10 10 10 ] }, ...
         { 'style', 'listbox', 'string', 'Choice 1|Choice 2|Choice 3' } } );
The res output contains the results – in this case, a cell array containing a single value from 1 to 3 indicating the user’s choice (for instance, { [1] }). The number of elements in this cell array depends on the number of UIs returning output (in general text and button do not return output but checkboxes, listboxes, and edit boxes do). Another way to use this function is to set tag for each UI and use the 4th output:
  [res userdata err structout] = inputgui( 'geometry', { [1 1] }, ...
         'geomvert', [3], 'uilist', { ...
         { 'style', 'text', 'string', [ 'Make a choice' 10 10 10 ] }, ...
         { 'style', 'listbox', 'string', 'Choice 1|Choice 2|Choice 3' 'tag' 'list' } } );
Now the output structure structout includes a field named list that contains the output of the listbox UI (structout.list = 1 for instance). This is convenient for creating GUIs, as developers do not need to remember the output order. You may change the order of lines, and you will not have to change any other part of your script.
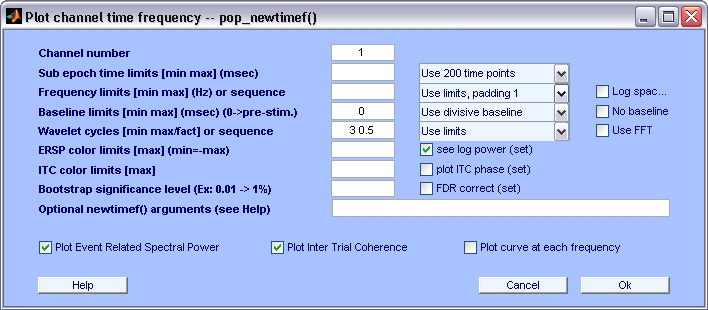
A complex UI shown below uses this technique. It is inspired by the pop_newtimef function.
    g = [1 0.3 0.6 0.34];
    geometry = { g g g g g g g g [1.025 1.27] [1] [1.2 1 1.2]};
    uilist = { ...
      { 'Style', 'text', 'string', 'Channel number', 'fontweight', 'bold'  } ...
      { 'Style', 'edit', 'string', '1' 'tag' 'chan'} {} {} ...
      ...
      { 'Style', 'text', 'string', 'Time limits [min max] (msec)', 'fontweight', 'bold' } ...
      { 'Style', 'edit', 'string', ' ' 'tag' 'tlimits' } ...
      { 'Style', 'popupmenu', 'string', 'Use 50 time points|Use 100 time points' ...
        'tag' 'ntimesout' 'value' 4} { } ...
      { 'Style', 'text', 'string', 'Frequency limits (Hz)', 'fontweight', 'bold' } ...
      { 'Style', 'edit', 'string', ' ' 'tag' 'freqs'  } ...
      { 'Style', 'popupmenu', 'string', 'Use limits, padding 1|Use limits, padding 2' ...
        'tag' 'nfreqs' }  ...
      { 'Style', 'checkbox', 'string' 'Log spaced' 'value' 0 'tag' 'freqscale' } ...
      ...
      { 'Style', 'text', 'string', 'Baseline limits [min max] (msec) (0->pre-stim.)', ...
        'fontweight', 'bold' } ...
      { 'Style', 'edit', 'string', '0' 'tag' 'baseline' } ...
      { 'Style', 'popupmenu',  'string', 'Use divisive baseline|Use standard deviation' ...
        'tag' 'basenorm' } ...
      { 'Style', 'checkbox', 'string' 'No baseline' 'tag' 'nobase' } ...
      { 'Style', 'text', 'string', 'Wavelet cycles [min max/fact] or sequence', ...
        'fontweight', 'bold' } ...
      { 'Style', 'edit', 'string', '3 0.5' 'tag' 'cycle' } ...
      { 'Style', 'popupmenu', 'string', 'Use limits|Use actual seq.' 'tag' 'ncycles' } ...
      { 'Style', 'checkbox', 'string' 'Use FFT' 'value' 0 'tag' 'fft' } ...
      { 'Style', 'text', 'string', 'ERSP color limits [max] (min=-max)', ...
        'fontweight', 'bold' } ...
      { 'Style', 'edit', 'string', ' ' 'tag' 'erspmax'} ...
      { 'Style', 'checkbox', 'string' 'see log power (set)' 'tag' 'scale' 'value' 1} ...
      {} ...
      { 'Style', 'text', 'string', 'ITC color limits [max]', 'fontweight', 'bold' } ...
      { 'Style', 'edit', 'string', ' ' 'tag' 'itcmax'} ...
      { 'Style', 'checkbox', 'string' 'plot ITC phase (set)' 'tag' 'plotphase' } {} ...
      { 'Style', 'text', 'string', 'Bootstrap significance level (Ex: 0.01 -> 1%)', ...
        'fontweight', 'bold' } ...
      { 'Style', 'edit', 'string', ' ' 'tag' 'alpha'} ...
      { 'Style', 'checkbox', 'string' 'FDR correct (set)' 'tag' 'fdr' } {} ...
      { 'Style', 'text', 'string', 'Optional newtimef() arguments (see Help)', ...
        'fontweight', 'bold'} ...
      { 'Style', 'edit', 'string', ' ' 'tag' 'options' } ...
      {} ...
      { 'Style', 'checkbox', 'value', 1, 'string', ...
        'Plot Event Related Spectral Power', 'tooltipstring', ...
        'Plot log spectral perturbation image in the upper panel' 'tag' 'plotersp' } ...
      { 'Style', 'checkbox', 'value', 1, 'string', ...
        'Plot Inter Trial Coherence', 'tooltipstring', ...
        'Plot the inter-trial coherence image in the lower panel' 'tag' 'plotitc' } ...
      { 'Style', 'checkbox', 'value', 0, 'string', ...
        'Plot curve at each frequency' 'tag' 'plotcurve' } ...
      };

      [ tmp1 tmp2 strhalt structout ] = inputgui( geometry, uilist, ...
           'pophelp(''pop_newtimef'');', 'Plot channel time frequency -- pop_newtimef()');
Copying and pasting the script above should generate the GUI below. Note how simply the geometry was defined. The supergui.m function automatically adapts the width and height of the window to the containing elements. Also, note the Help button, which executes the command “pophelp(pop_newtimef);” defined in the inputgui.m command-line call. Upon pressing Ok, the fields of the structout structure contain all the user entries in the GUI.
Advanced GUI design
One limitation of the supergui.m calling format is that it is not possible to define random geometries. Any given line needs to span the same height. There is an advanced calling format that allows circumventing that problem.
  supergui('geom', { {2 2 [0 0] [1 2] } { 2 2 [1 0] [2 1] } { 2 2 [1 1] [2 2] } }, ...
           'uilist', { { 'style' 'listbox' 'string' 'cell 1|cell 2' } ...
                       { 'style' 'checkbox' 'string' 'cell 3' } ...
                       { 'style' 'text' 'string' 'cell 4' } });
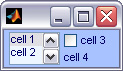
The geom input above is detailed in the help section of the supergui.m function.
How to write an EEGLAB extension
EEGLAB also has an extension (also called plugin) facility that automatically searches for functions loaded into a specified plugin directory, causing one or more menu items calling the extension to appear in the EEGLAB menu. EEGLAB extensions can be offered for download and use by anyone, independent of the EEGLAB distribution. They can be included in the EEGLAB extension manager.
EEGLAB will automatically incorporate any appropriately named plugin functions that are named eegplugin_myfunc.m that EEGLAB finds in the same directory as eeglab.m. (Here, myfunc should be the name of the main signal processing function for the extension). Creating an eegplugin_ function in this directory will add a menu item with the menu label(s) specified in your eegplugin_ function to the bottom of the specified top-level EEGLAB menu (this extension menu label being possibly linked to an unlimited number of sub-menus). This menu item (or items) can call standard or custom EEGLAB data processing and pop_ functions (see examples below). When a user downloads an EEGLAB extension (either from the EEGLAB extension manager, the main EEGLAB site, or any other web site), the eegplugin_ function will then be detected by EEGLAB at startup (by looking for files or directories with names beginning eegplugin_ in the main EEGLAB directory).
Creating an eegplugin_ function
To create a new EEGLAB extension, simply create a MATLAB function file whose name begins with eegplugin_ and place it in the plugins function subdirectory. This function must take three arguments, as in the ‘test’ extension eegplugin_ function shown below:
>> eegplugin_test (fig, try_strings, catch_strings);
The three arguments above are provided to the eegplugin_ function by EEGLAB. The first argument is the handle of the main EEGLAB window. The second and third arguments are structures passed by EEGLAB that allow the eegplugin_ function to check parameters, detect errors, etc. (see below). Suppose you do not want your extension to use EEGLAB history and error message handling. In that case, you can ignore the last two parameters (although the eegplugin_ function definition still must list all three arguments, or EEGLAB will not be able to call it).
Adding an extension menu item or sub-menu
To create a new menu item for your extension under a top-level EEGLAB menu, simply add a command like this to your eegplugin_ function:
uimenu(fig,'label', 'My menu item','callback',...
  ['EEG=pop_myfunc(EEG); ...
  [ALLEEG EEG CURRENTSET] = eeg_store(ALLEEG, EEG, CURRENTSET);' ]);
The statement [ALLEEG EEG CURRENTSET] = eeg_store(ALLEEG, EEG, CURRENTSET); above ensures that your modified EEG dataset will be stored in the EEGLAB ALLEEG structure. myfunc should be replaced with your extension’s name, and My menu item with a brief menu-item label (typically the name of your extension).
Extensions and EEGLAB history
If you want your extension to interact with the EEGLAB history mechanism, you should take advantage of the second (‘try_strings’) and third (‘catch_strings’) arguments to your eegplugin_ function call. The second argument (see eegplugin_test.m above) contains commands (organized into a MATLAB structure) that check the input dataset and attempt to execute your command. The third argument (‘catch_strings’) includes commands to handle errors and add the contents of the LASTCOM (i.e., last command) variable to the EEGLAB history.
eegplugin_ functions should declare one or more EEGLAB menu items. Each menu declaration should look like this:
uimenu( submenu, 'label', 'My menu item', 'callback', ...
  [ try_strings.anyfield '[EEG LASTCOM] = pop_myfunc(EEG);' ...
  catch_strings.anyfield ]);
Possible fields for ‘try_strings’ (above) are:
- try_strings.no_check : check for the presence of a non-empty EEG dataset only
- try_strings.check_ica : check that the dataset includes ICA weights
- try_strings.check_cont : check that the dataset is continuous
- try_strings.check_epoch : check that the dataset is epoched (not continuous data)
- try_strings.check_event : check that the dataset contains events
- try_strings.check_epoch_ica : check that the dataset is epoched and includes ICA weights
- try_strings.check_chanlocs : check that the dataset contains a channel location file
- try_strings.check_epoch_chanlocs : check that the dataset is epoched and includes a channel locations (chanlocs) file
- try_strings.check_epoch_ica_chanlocs : check that the dataset is epoched and includes ICA weights and a channel locations file.
Possible fields for ‘catch_strings’ are:
- catch_strings.add_to_hist : add the LASTCOM variable content (if not empty) to the EEGLAB history
- catch_strings.store_and_hist : add the LASTCOM variable content (if not empty) to the EEGLAB history and store the EEG dataset in the ALLEEG variable.
- catch_strings.new_and_hist : add the LASTCOM variable content (if not empty) to the EEGLAB history and pop up a new dataset window.
eegplugin_ function examples
A simple type of eegplugin_ function might only call a plotting function. For instance, to write a simple extension to plot the ERP trial average at every channel in a different color (without performing any data checking):
% eegplugin_erp() - plot ERP plugin
function eegplugin_erp( fig, try_strings, catch_strings)

% create menu
plotmenu = findobj(fig, 'tag', 'plot');
uimenu( plotmenu, 'label', 'Plot ERP', ...
  'callback', 'figure; plot(EEG.times, mean(EEG.data,3));');
Save the text above as a file eegplugin_erp.m into the plugins sub-directory of EEGLAB and restart EEGLAB (click here to download this function). Then, given an epoched dataset, select the menu item Plot → Plot ERP to plot the ERP average of all the dataset epochs.
We describe another example below. To create an extension named PCA that would apply PCA to your data and store the PCA weights in place of the ICA weights (Note: Not recommended for most purposes!), save the MATLAB commands below as file eegplugin_pca.m into the plugins sub-directory of EEGLAB and restart EEGLAB (click here to download this .m file).
% eegplugin_pca() - a pca plugin
function vers = eegplugin_pca(fig, trystrs, catchstrs)

vers = 'pca1.00';

% find tools menu
menu = findobj(fig, 'tag', 'tools');

% PCA command
cmd = [ '[~, EEG.icawinv] = runpca(EEG.data(:,:));' ];
cmd = [ cmd 'EEG.icaweights = pinv(EEG.icawinv);' ];
cmd = [ cmd 'EEG.icasphere = eye(EEG.nbchan); disp(''Done'');' ];

% create menu
uimenu( menu, 'Label', 'Run PCA', 'CallBack', cmd, 'separator', 'on');
Note: You may use eegplugin_ functions to append new extension-related menu items under different EEGLAB menu headings. Above, we add an item (labeled ‘Run PCA’) to the Tools menu by specifying ‘’ ‘tag’,’tools’ ‘’ in the findobj.m call. If the specified tag were import data, EEGLAB would add the specified menu item to the File → Import data sub-menu. Using the tag import epoch would add the specified menu item to the File → Import epoch info sub-menu. The tag import event would add the specified menu item to the File → Import event info menu. The tag export would add the specified menu item to the File → Export data menu. Finally, the tag plot would add the specified menu item to the Plot menu. (Note that the tag should be in lower case).
After installing the eegplugin_ function above, a new EEGLAB menu item Tools → Run PCA will be created. Use this menu item to learn the PCA transform for the current EEG dataset. The resulting PCA decomposition will be stored in place of the ICA decomposition. (Note: This is possible (if not typically advisable) since both PCA and ICA are linear decompositions).
See the EEGLAB erpsource extension for an example of a more elaborate extension.
EEGLAB menu integration
Since 2011, the user can control menu behavior within EEGLAB. EEGLAB can automatically enable or disable (e.g., gray out and make unresponsive) menu items based on data in memory. This may result in some extension-related menu items being automatically disabled when they should not be. Thus, we implemented a menu item activation scheme that makes it possible to control when an extension’s menu item(s) will be active. To do so, developers must incorporate several keywords in the userdata field of the menu item:
| Keyword | Default | Description |
|---|---|---|
| epoch | on | set to off to disable the menu item for epoched datasets |
| continuous | on | set to off to disable the menu item for continuous datasets |
| startup | off | set to on to enable the menu item at startup (no data loaded) |
| study | off | set to on to enable the menu item when a STUDY is being processed |
| chanloc | off | set to on to disable the menu item if channel locations are absent |
Semicolons should separate keywords. An example of an extension-elated menu item that is enabled only at startup and when processing EEGLAB studies is shown below:
   toolsmenu = findobj(fig, 'tag', 'tools');
   uimenu( submenu, 'label', 'My menu', 'callback', mycommand, 'userdata', 'startup:on;study:on');
Note that adding epoch:on or continuous:on would not change the menu item behavior since these are default behaviors. The following example would enable the menu item only when processing continuous or epoched datasets that have channel locations present:
   toolsmenu = findobj(fig, 'tag', 'tools');
   uimenu( submenu, 'label', 'My menu', 'callback', mycommand, 'userdata', 'chanloc:on');
Omitting the userdata parameter results in the extension menu item adopting the default behaviors defined in the table above.
Submitting your plugin
You may then add your extension to the list above so that EEGLAB users can download it automatically from the EEGLAB plugin manager. To do this, use this form. If you want to upload a new version of your plugin, you can use this simplified form.
Assist with unmaintained plugins
An extensive collection of plugins are not maintained anymore by their author. Yet, they are still widely used. For example, the FMR-IB plugin from Rami Niazi (for artifact removal) is not supported anymore. There are several issues listed on Gitbub if you want to take over maintaining this plugin. Also, if there is an EEGLAB plugin you are using routinely, and it is no longer supported, consider becoming the maintainer for that plugin. You will get credit for it.