Spectral analysis of EEG signal
Spectral analysis of EEG signal is a central part of EEG data analysis. In this section, we will review the basic concepts underlying EEG spectral analysis. For a complete introduction to spectral analysis in EEG research, you may watch this series of short videos. Click on the icon on the top right corner to access the list of videos in the playlist.
Common EEG brainwaves
There are standard ranges of frequencies in human EEG that have been designated using specific names, as shown below.
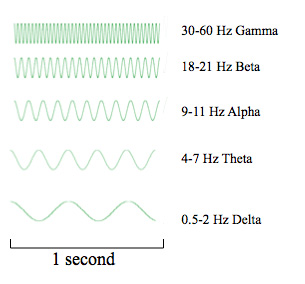
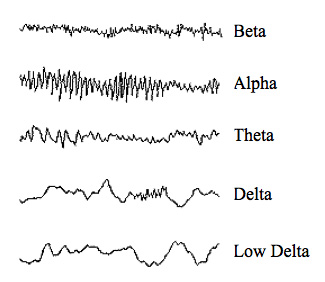
Note that these frequencies are never present as sinusoids in actual EEG data. Instead, we most often always observe a mixture of such frequencies.
EEG spectral decompositions
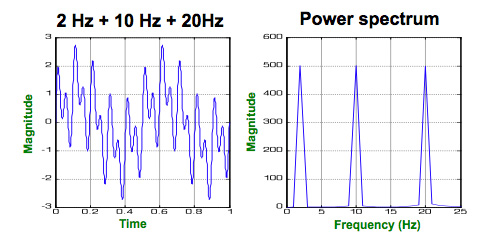
Actual EEG signals can be seen as a mixture of different frequencies. As shown below, when mixing 2Hz, 10Hz, and 20Hz signals, a complex signal may be observed.
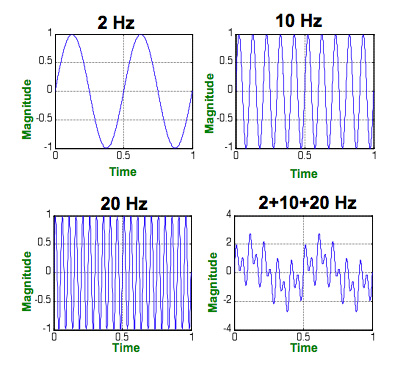
If we run a simple Fourier Transform on this data, we will observe three peaks of the same amplitude at 2, 10, and 20 Hz.
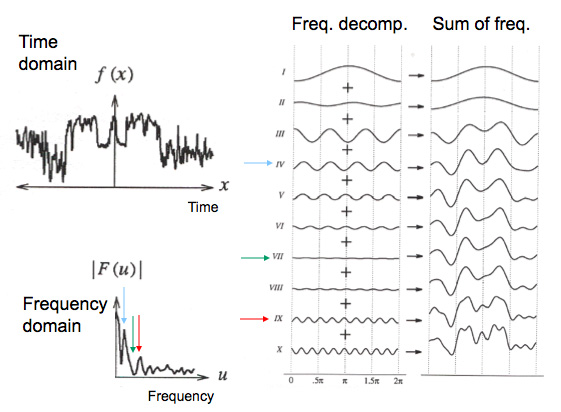
Now, let’s take a real EEG signal. It is possible to decompose such a signal into a superposition of sinusoids at different frequencies and phases (the horizontal offset). When summing these sinusoids, we may recover the original signal. This is the Fourier theorem in a nutshell.